
The European gas market has been shaped by LNG flows across the last 2 years.
In Q2 2020, a huge surplus of cargos due to the Covid induced demand shock, drove a TTF price plunge below 2 €/MWh.
Less than 9 months later in Jan 2021, an acute shortage of LNG in Asia saw all available cargoes diverted from Europe.
There are two important mechanisms that are supporting the European gas market absorb ebbs & flows in LNG imports.
In this week’s article we review current year storage dynamics vs the last 5 years and look at the evolution of key price signals driving storage value.
Europe entered Winter 2020-21 with inventories at 5 year highs as shown in Chart 1.

Chart 1: Current European winter withdrawal trajectory vs last 5 years (inc. Ukraine)
High stock levels were driven by the Covid demand shock dynamics of 2020. Inventories were seasonally high heading into last summer and rose rapidly as surplus volumes of LNG flowed to Europe and very low priced gas was injected into storage. Summer 2020 also saw a substantially increased role for Ukranian storage, acting as a ‘sink’ for surplus gas in order to allow the market to clear (along with US cargo cancellations).
The 2020 flood of LNG into Europe swung to drought in Q1 2021, as soaring Asian LNG demand and spot price levels saw cargos diverted away from Europe. The resulting gap in European LNG imports has been plugged by faster than normal storage withdrawals.
The largest drawdowns have been in Germany, as Gazprom pulls on equity storage to support strong sales volumes in January, despite a drop in transit import volumes from Russia.
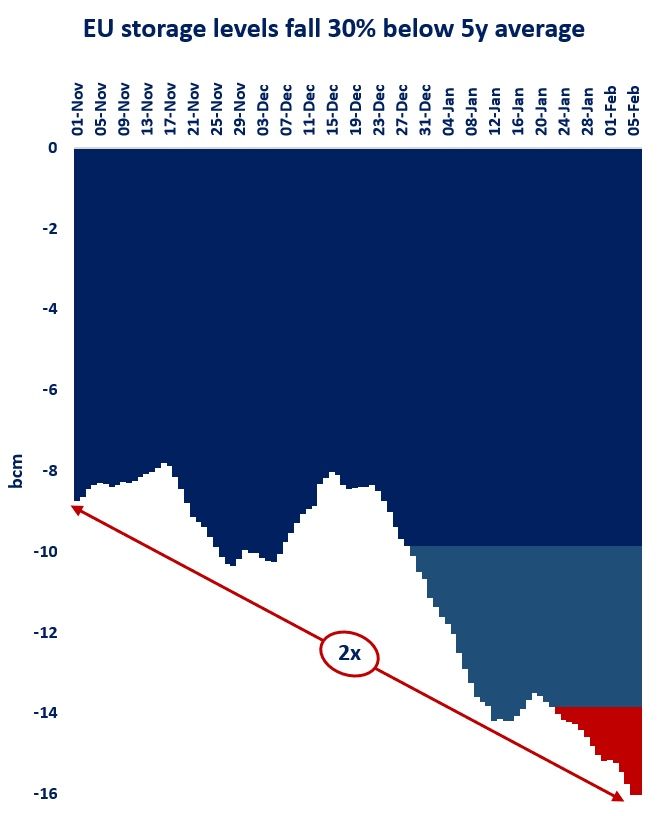
Chart 1 shows storage stocks for this winter (blue line) now below their 5 year seasonal average trajectory (black line). The green dashed line and blue dotted line illustrate potential trajectories across the remainder of the winter based on the maximum (Winter 18-19) and minimum (Winter 17-18) withdrawal paths across the last 5 years.
See the complete article on Timera Energy.
Source: Timera Energy
Follow on Twitter:
[tfws username=”TimeraEnergy” height=”700″ width=”350″ theme=”light” color=”#FAB81E” tweets=”2″ header=”yes” footer=”yes” borders=”yes” scrollbar=”yes” background=”yes”]

