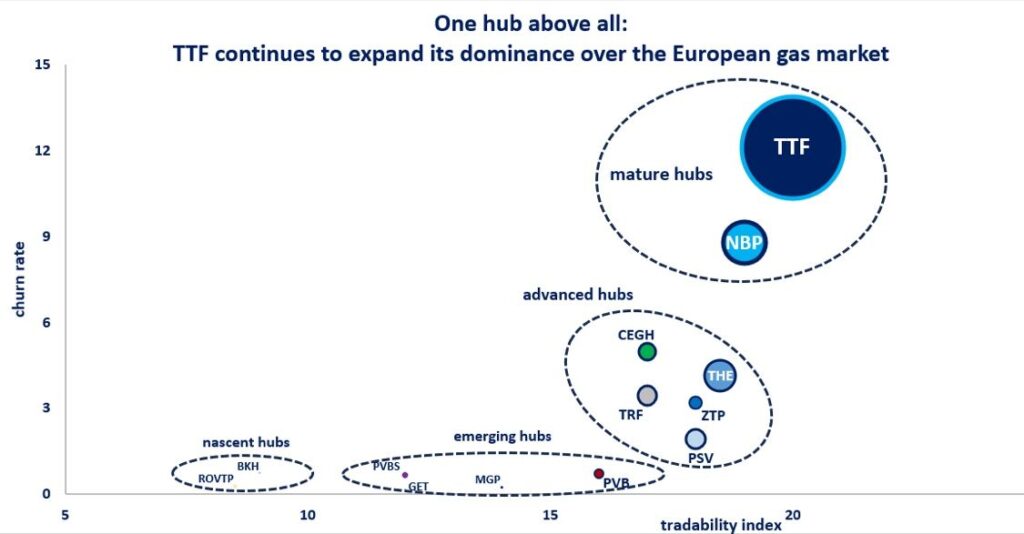
One hub above all: European gas trading expanded by almost tenfold in the last twenty years. this spectacular growth was largely supported by the market opening reforms in the European Union and in particular the Third Energy Package, adopted back in 2009.
Today traded volumes equate to more than ten times to the overall gas demand of the EU+UK, indicating an increasingly liquid traded market.
Traded volumes on TTF rose by around twenty times between 2012-22 and overpassed NBP in 2014 to become Europe’s largest gas hub.
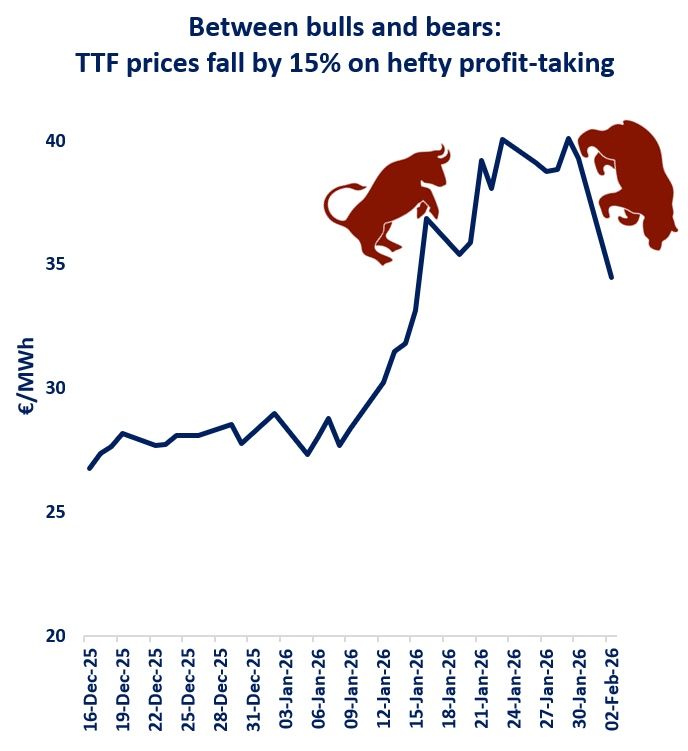
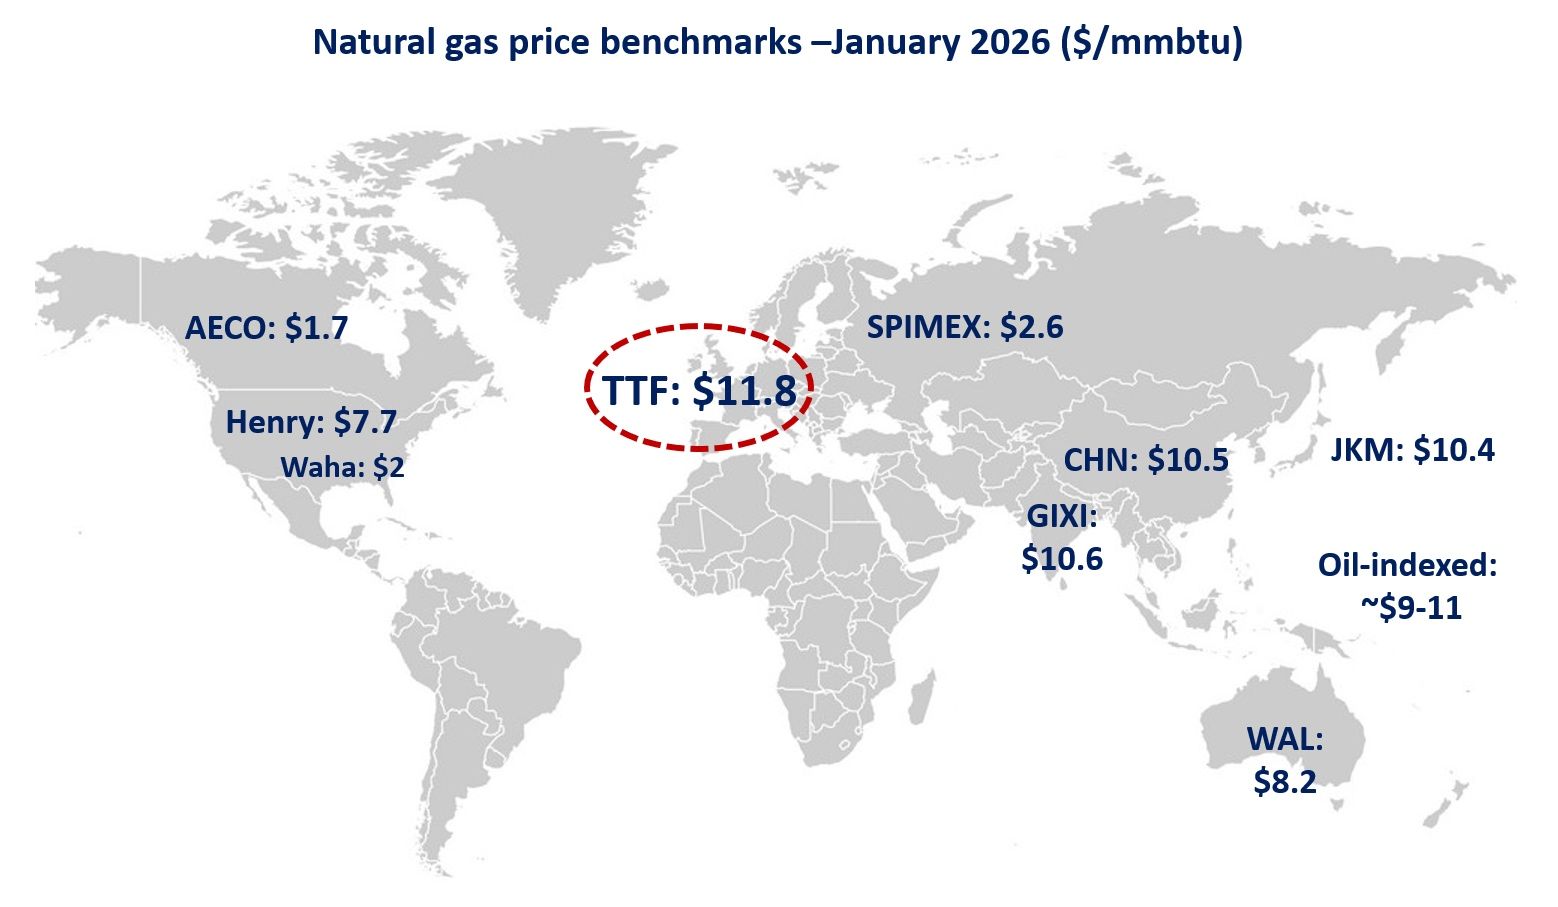
Today over 80% of gas trading is done on TTF and over 98% of the derivatives are traded on the Dutch hub, which serves as a hedging venue not only to European midstream utilities, but also to international portfolio players and global gas traders.
TTF has a churn rate of over 100 when measured as a comparison to the Dutch gas demand. here we used the northwest European market area (-UK), which still gives a churn of over 10.
TTF continued to it expansion over the European trading landscape, with volumes rising by 30% yoy in the first three quarters of 2023.
what is your view? how will European gas trading evolve in the coming years? how will TTF’s role change? will it solidify its position as the Global Gas Wheel?
Source: Greg Molnar (LinkedIn)

