The authors use 4 charts to demonstrate the key influence of the US gas & crude markets on European hub and LNG market pricing dynamics & consider what happens next.
It is no secret that the LNG market has been oversupplied since Q4 2018. Surplus cargoes have flowed to Europe where a price responsive power sector has absorbed gas via switching of gas for coal plants. As such, European hubs were the key marginal clearing mechanism for the LNG market and the main driver of LNG spot prices from Q4 2018 to Q4 2019.
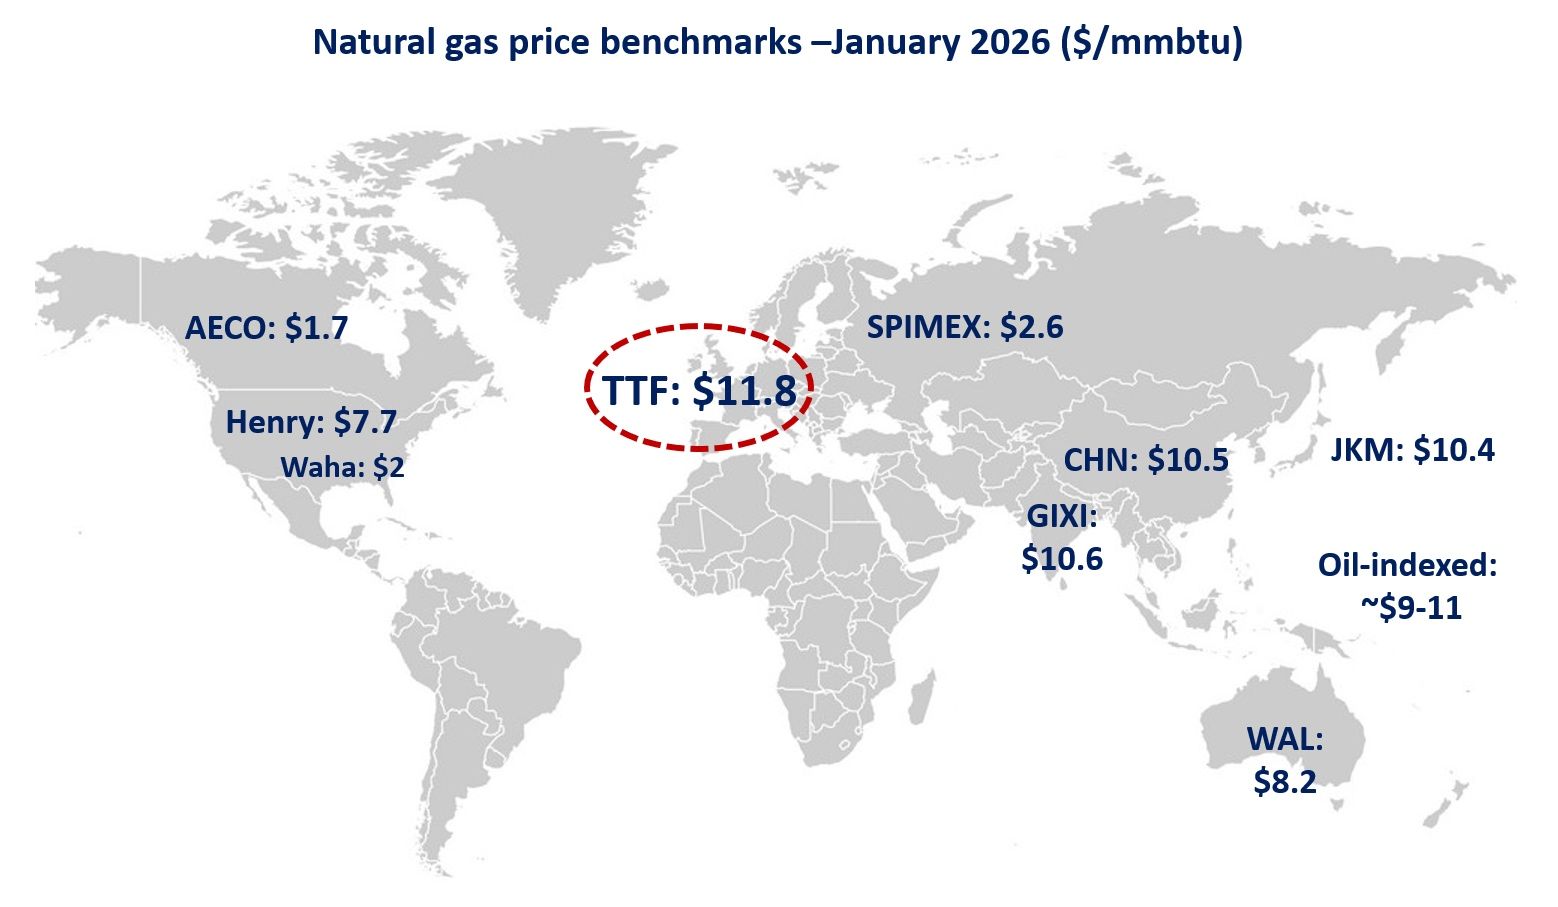
Volumes of surplus LNG have grown in 2020, with commissioning of new supply into a Covid impacted market. This has seen Europe displaced as the driver of LNG market pricing in favour of the US. This was reflected in dramatic style in early Q2-2020 as TTF and NBP hub prices crashed through US Henry Hub levels.
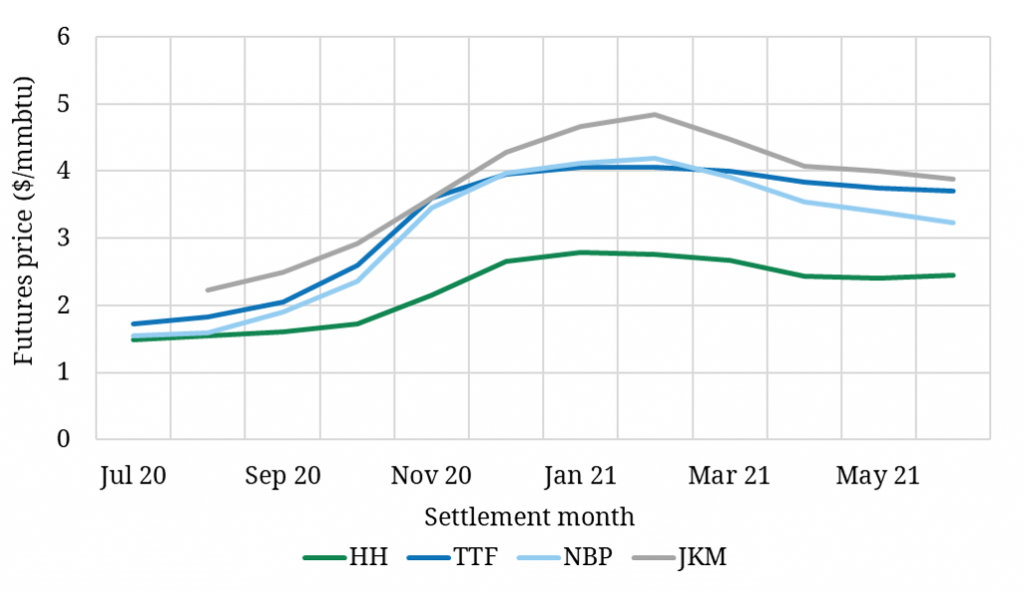
European hub prices trading at a discount to Henry Hub represented price signals shouting ‘Europe has had enough’. Chart 1 shows how as of Jun 2020, forward markets are responding.

Both TTF and NBP are now trading back at a clear premium to Henry Hub across Summer 2020 as US export volumes are ‘shut in’. As export gas is pushed back into a US market with high storage inventories, Henry Hub has fallen to its lowest level in 25 years.
Forward curves show the premium of European over US prices rising into winter, as the acute current supply imbalance is alleviated.
Connect with Timera Energy via Twitter (& view the complete article and 3 other charts):
[tfws username=”TimeraEnergy” height=”700″ width=”350″ theme=”light” color=”#FAB81E” tweets=”2″ header=”yes” footer=”yes” borders=”yes” scrollbar=”yes” background=”yes”]

