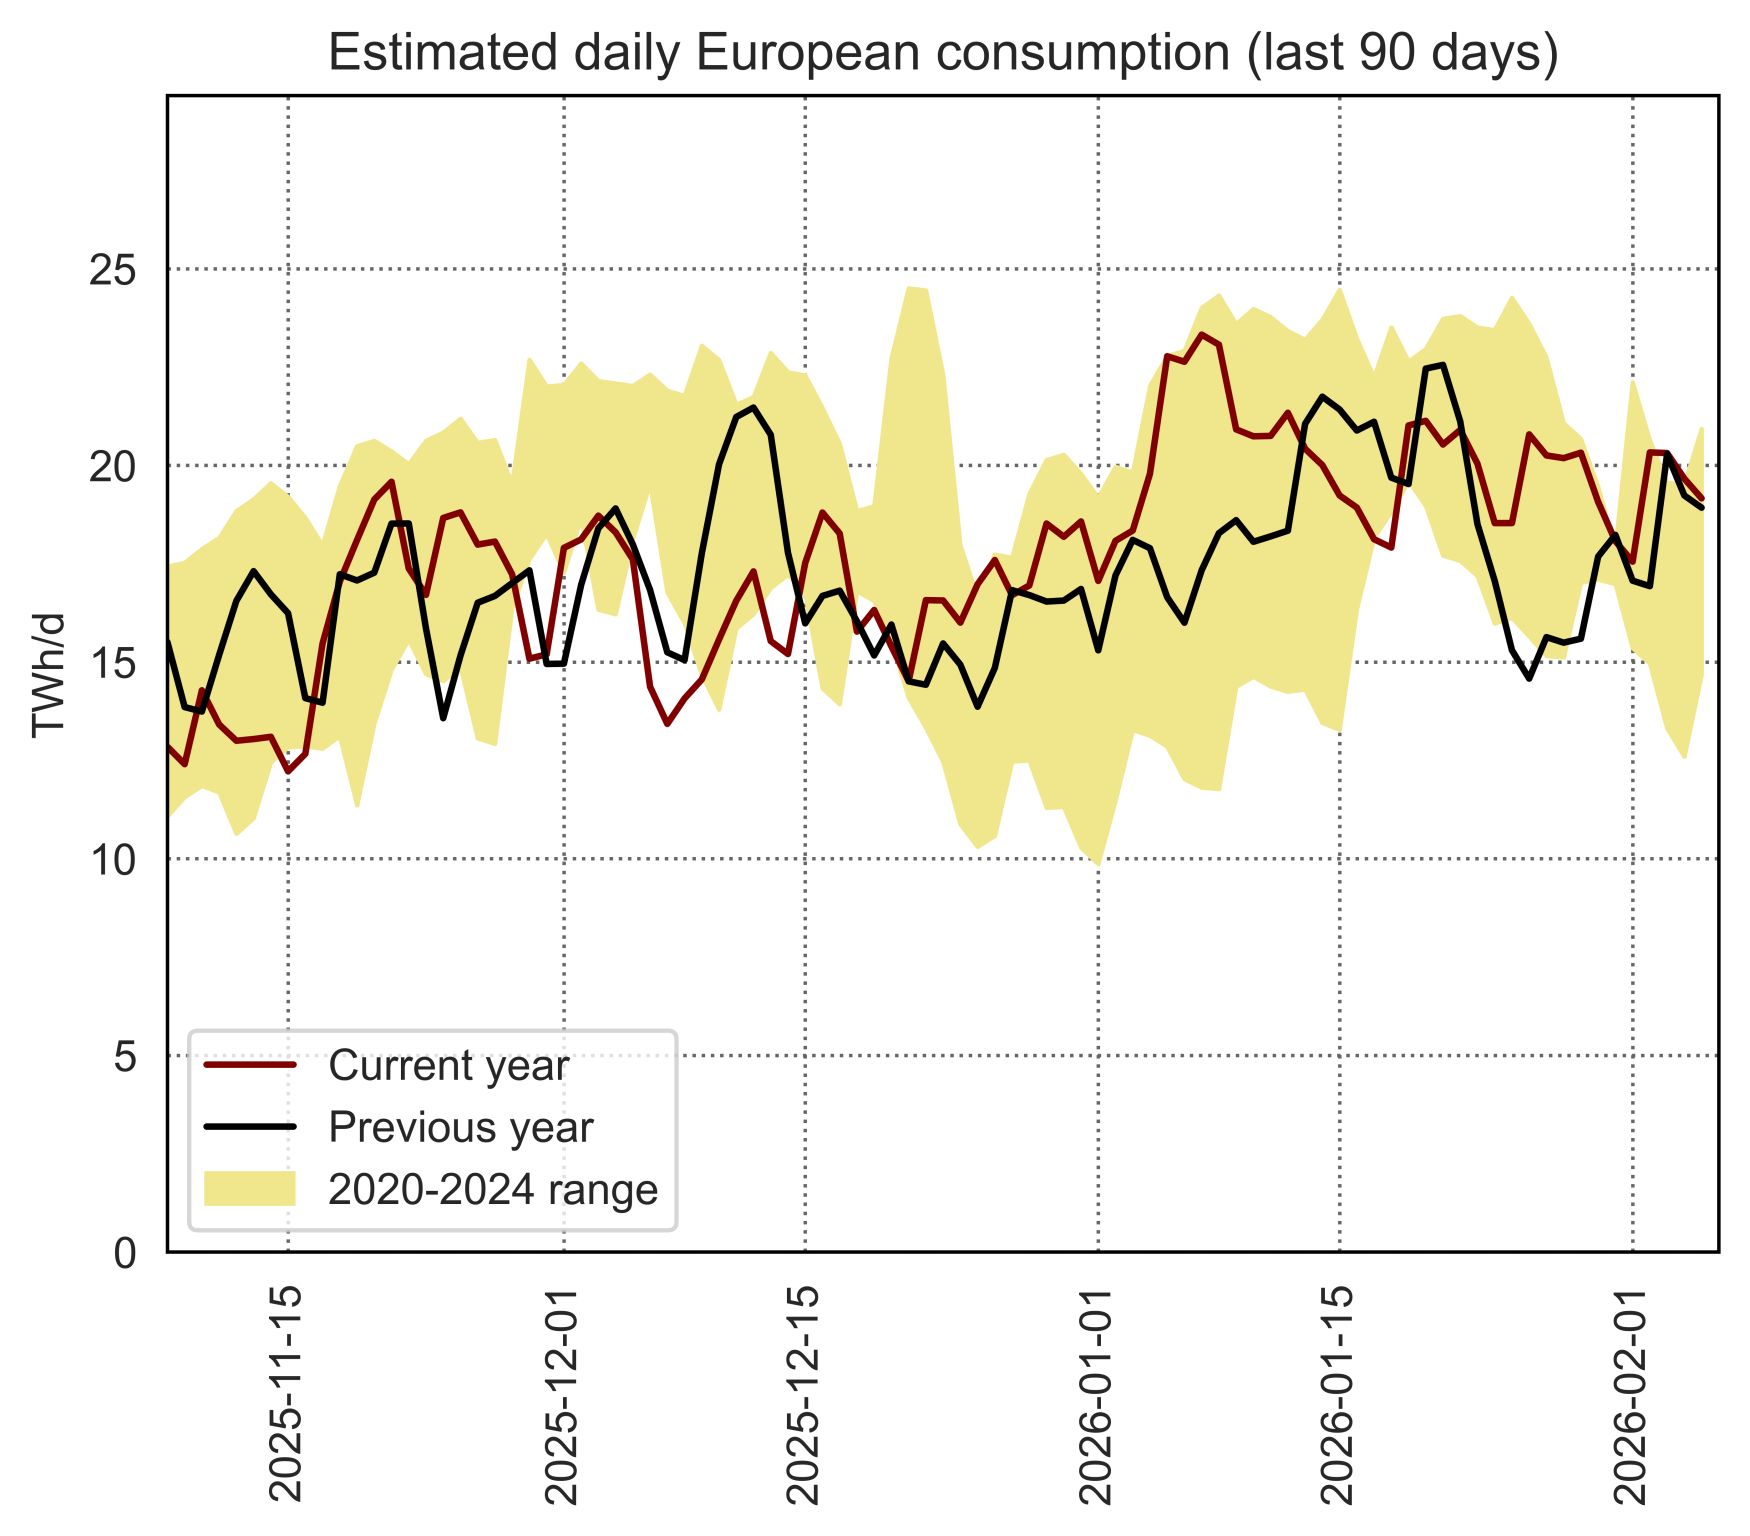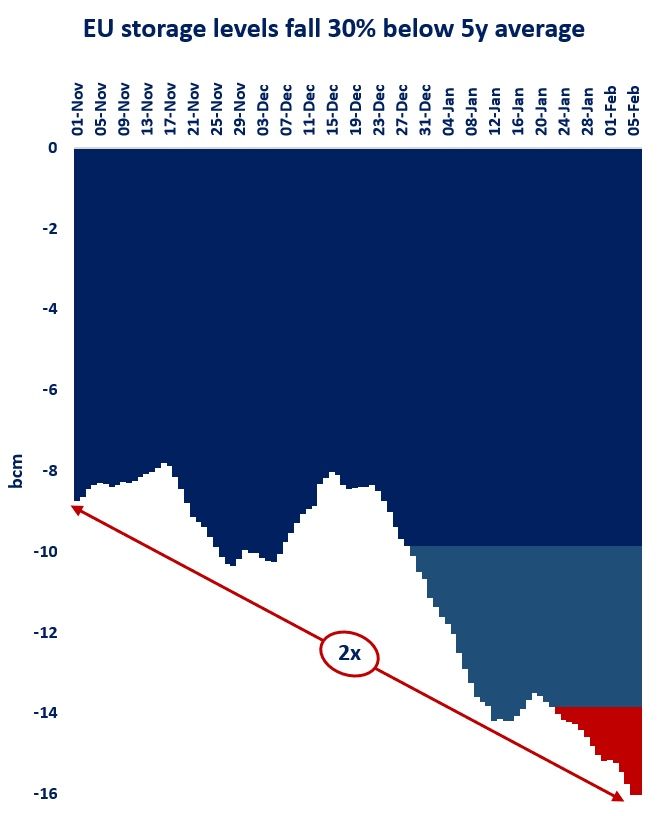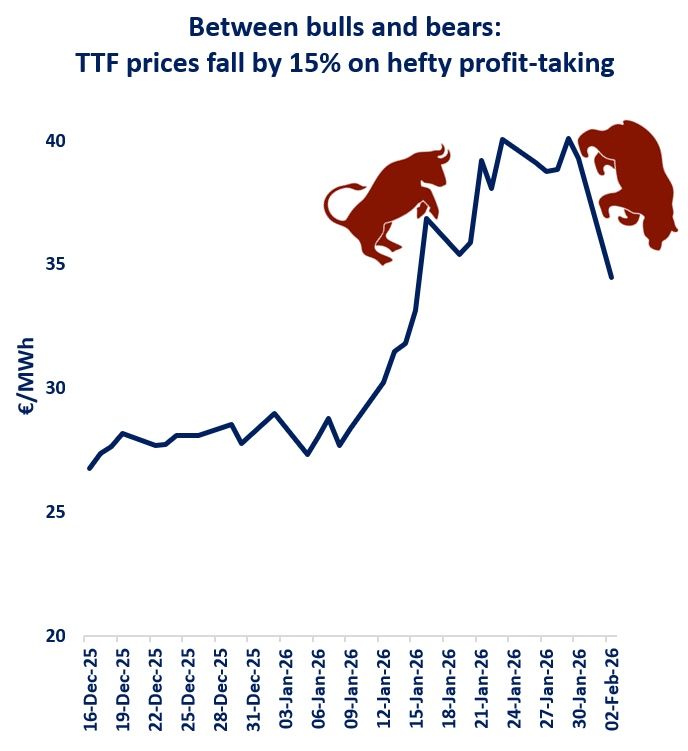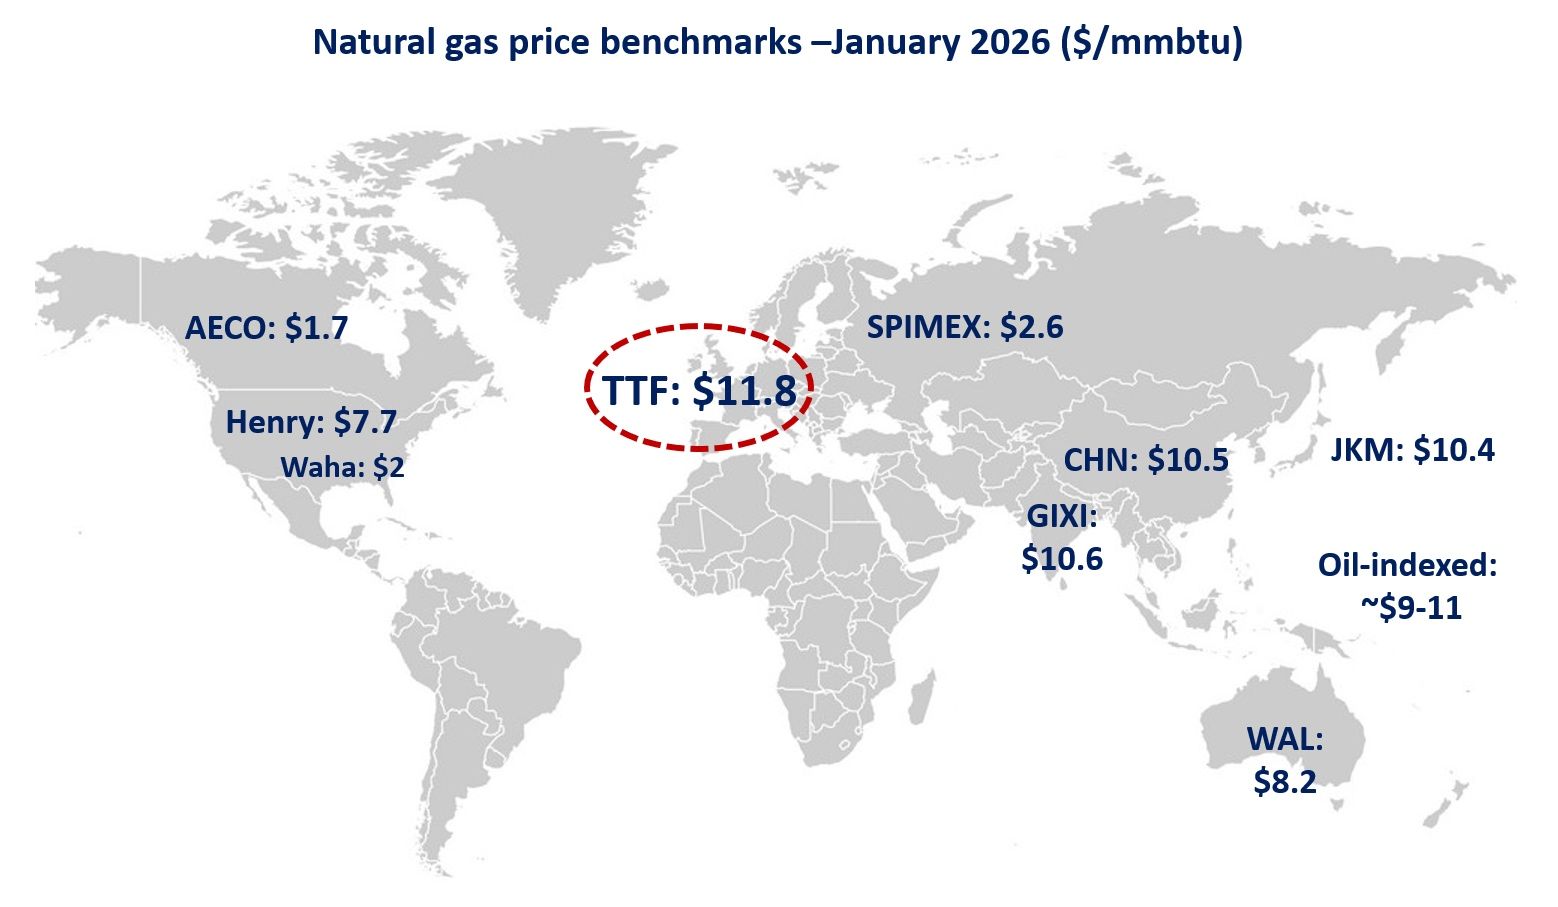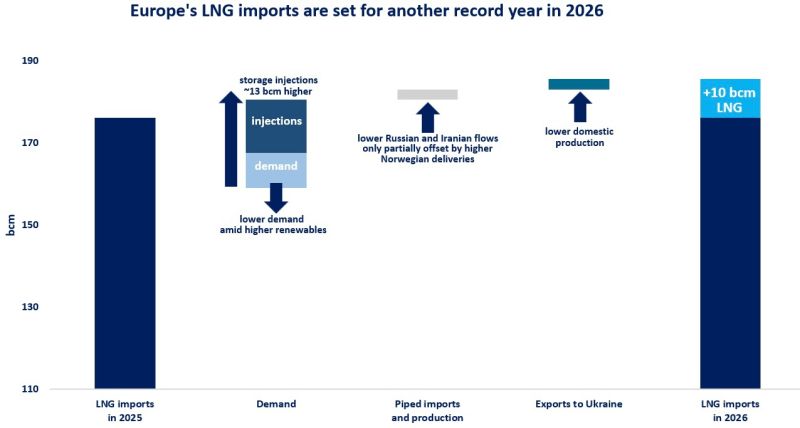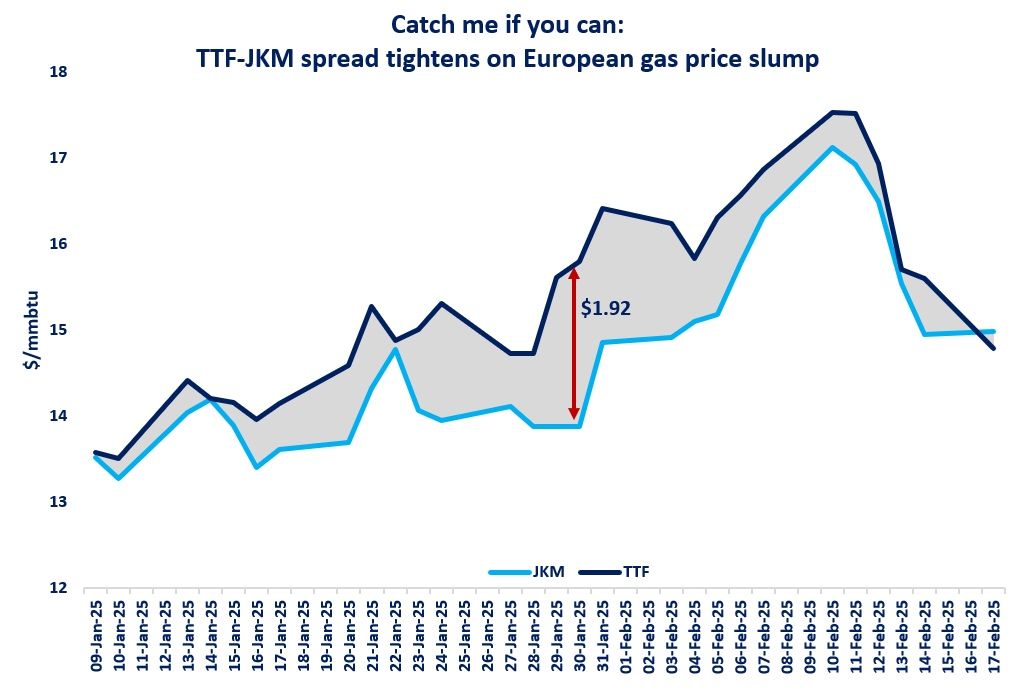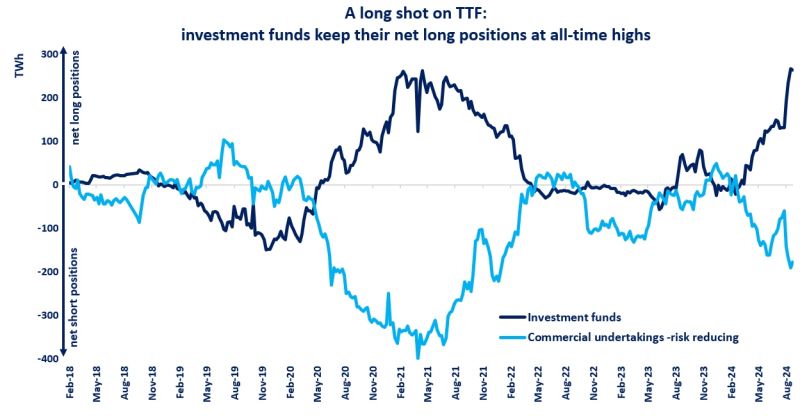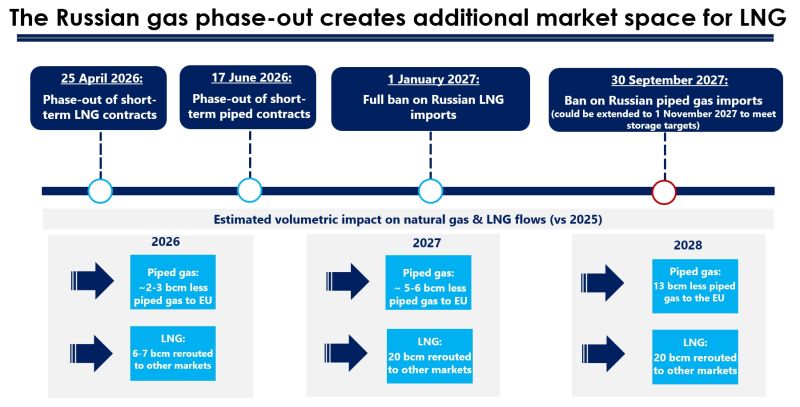

If somebody asked you to find the irrelevant image among the graphs given below, it would not be a problem to give the right answer. Each of the four diagrams shows the evolution of gas prices over the last months, when contracts at key European hubs were hitting their multi-year highs one after another. But while it may seem as if prices move synchronously, there is no uniformity across the curve.
Prompt and near-curve contracts have predictably posted the biggest gains in the second quarter. The combination of several factors, about which so much had already been said, resulted in Europe not having enough volumes both to meet the current demand and to ensure healthy injections into the storages. This month, TTF Day-Ahead settled above the level it had been assessed at in January and Q4 ’21 product rose to be at a premium against Q1 ’22.
Contracts further out on the curve followed products for delivery in 2021 – early 2022, but the Dutch front-year price was rising at only about half that rate. Fundamentally, the far curve ‘weakness’ stems from the lack of factors that have supported this year’s monthly and quarterly contracts.
Low levels of gas in storage, for now, have a small impact on year-ahead values, while weather conditions for the following year are unknown and 2022 LNG flow patterns is not easy to predict. Thus, one of the few solid things the front-year contract can rely on now is bullish carbon.
And most importantly, increasing pressure on the far curve is coming from expectations that additional gas volumes should enter the regional market next year as new supply routes are being launched and existing ones expanded. The progress made in constructing Nord Stream 2, full capacity expected on TAP as well as further extension of the TurkStream pipeline are all taken into account when assessing contracts for delivery in 2022 and beyond.
Source: Yakov Grabar
See original post by Yakov at LinkedIn.

