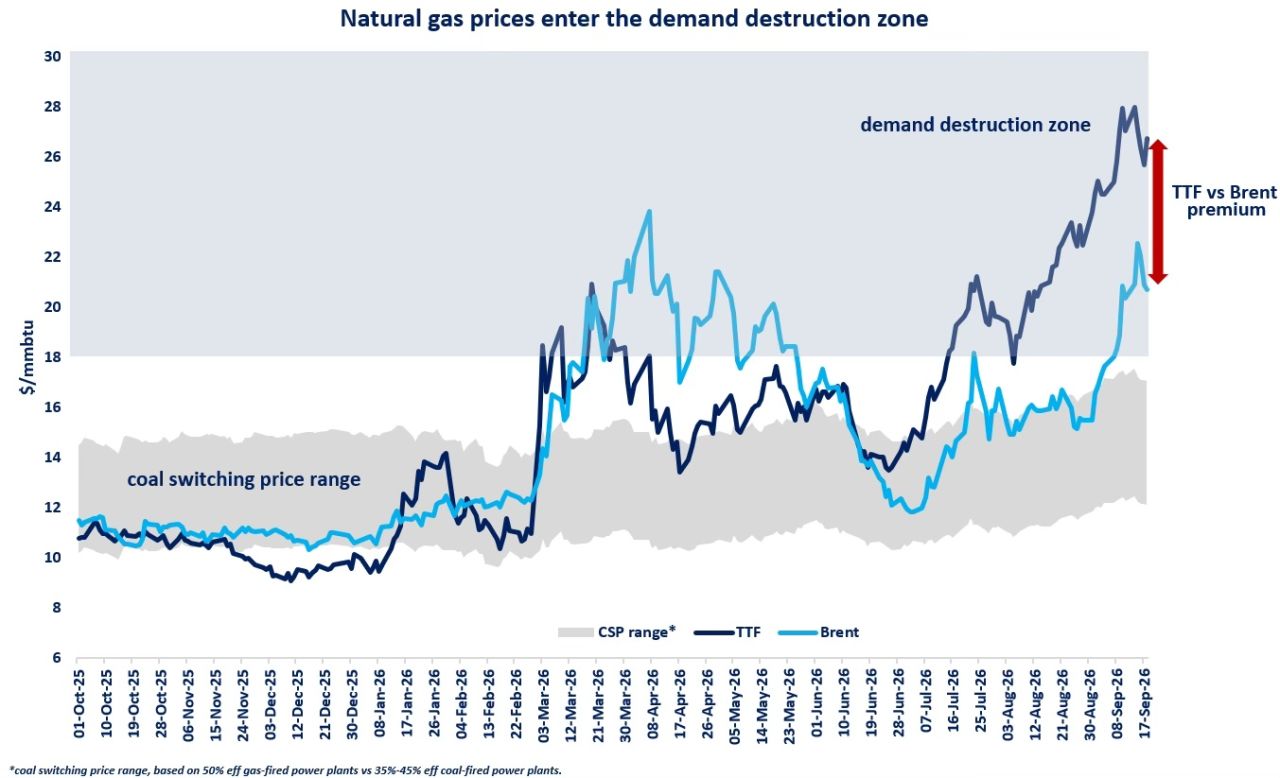
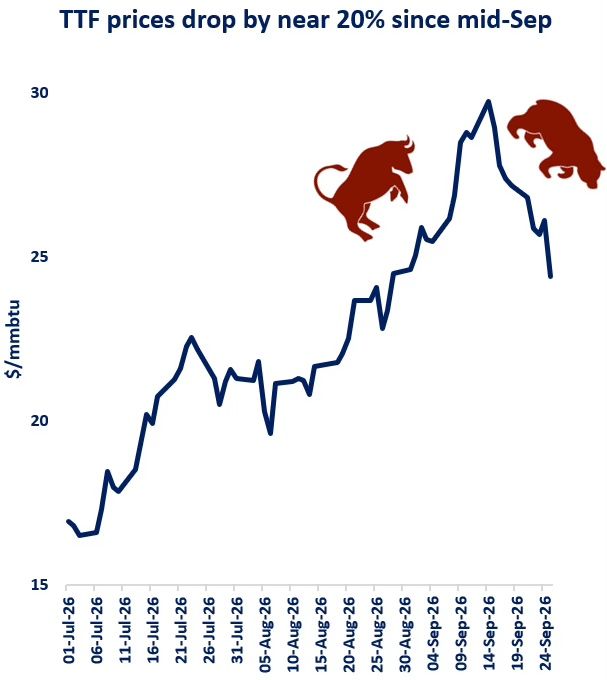
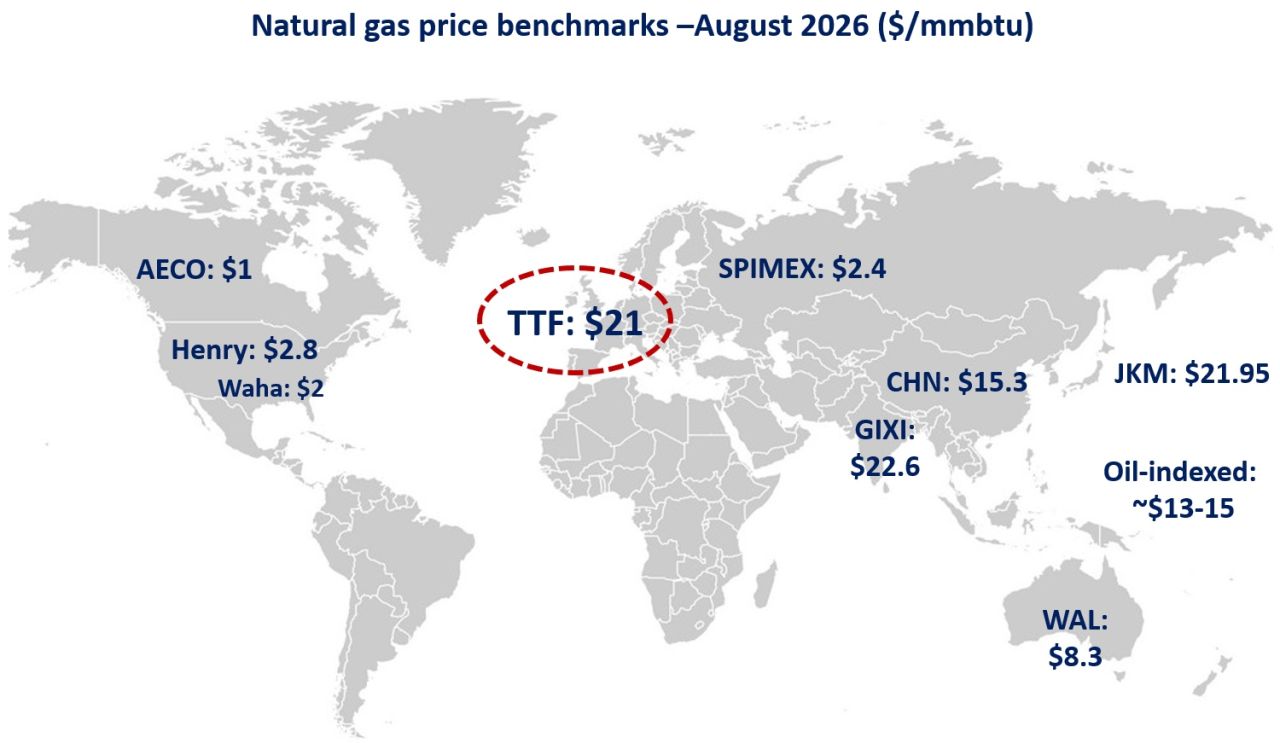
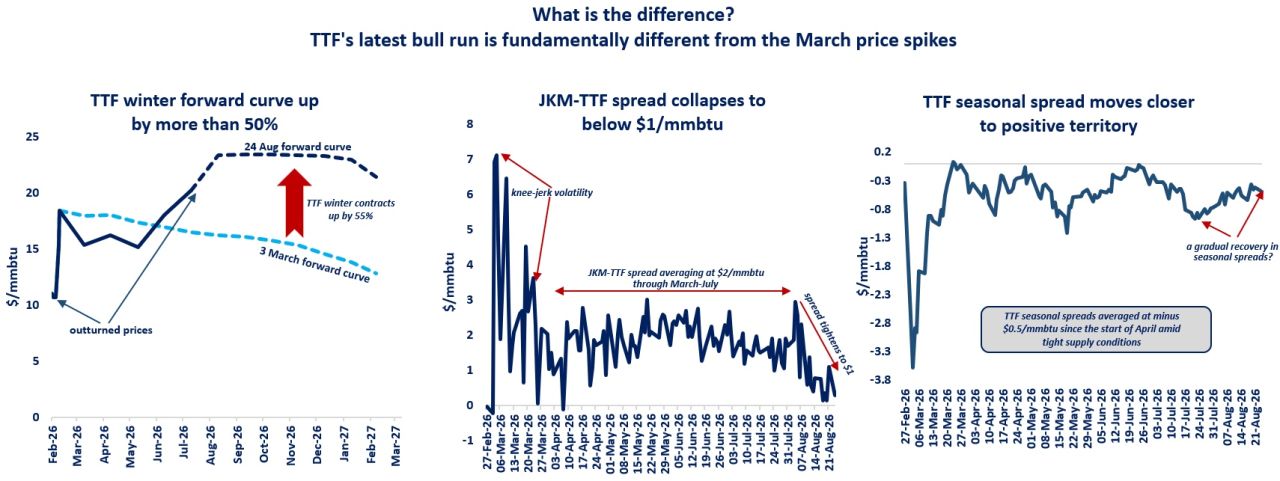
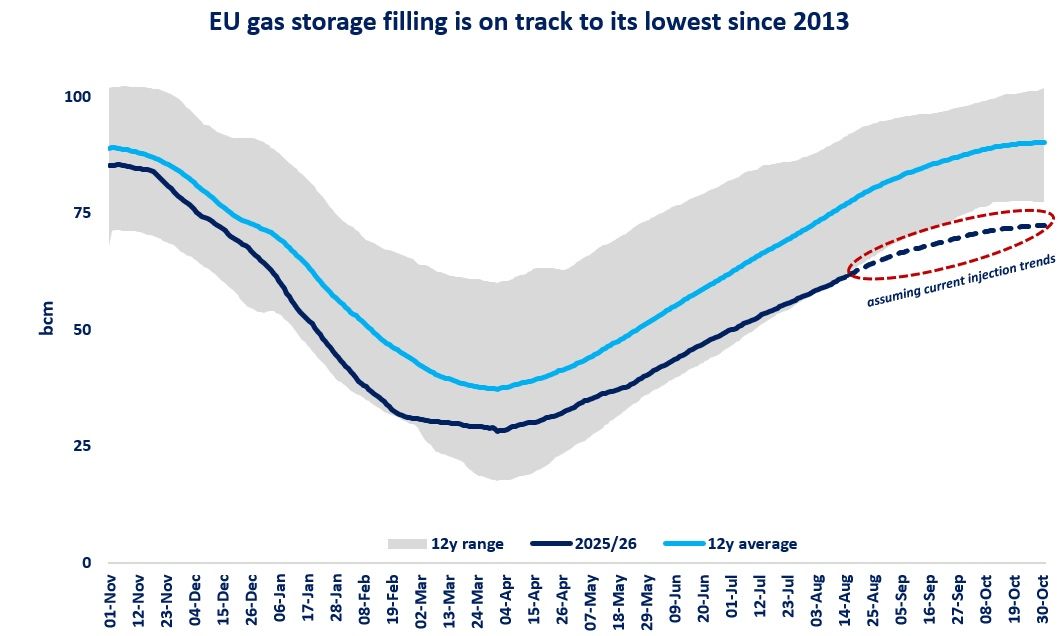
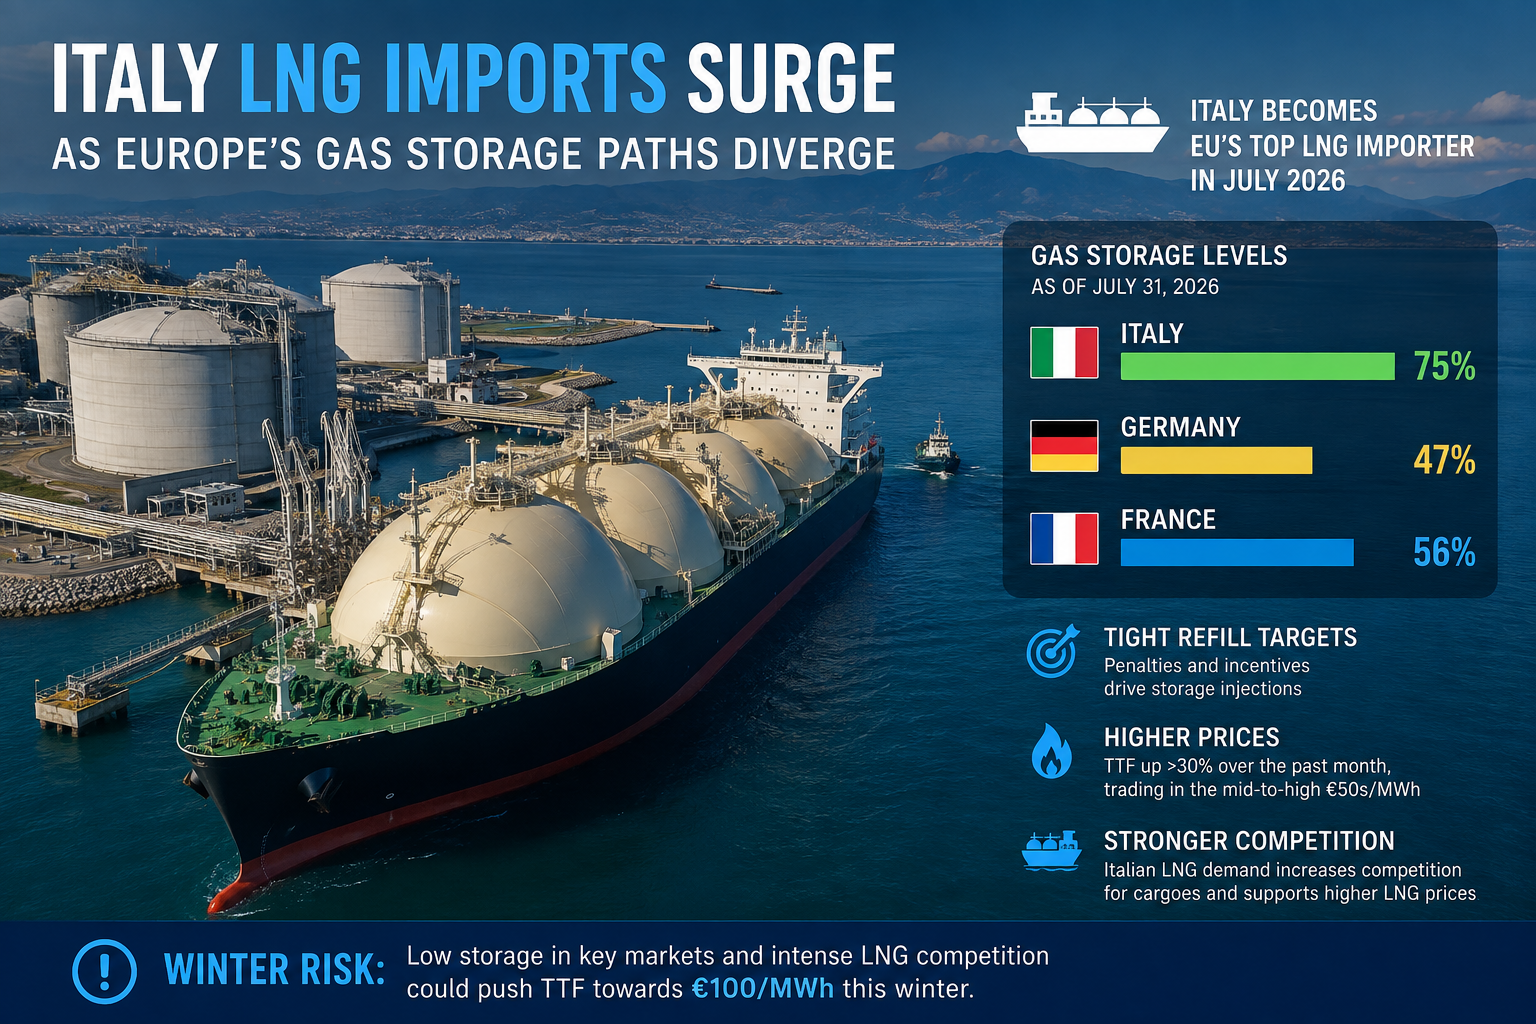
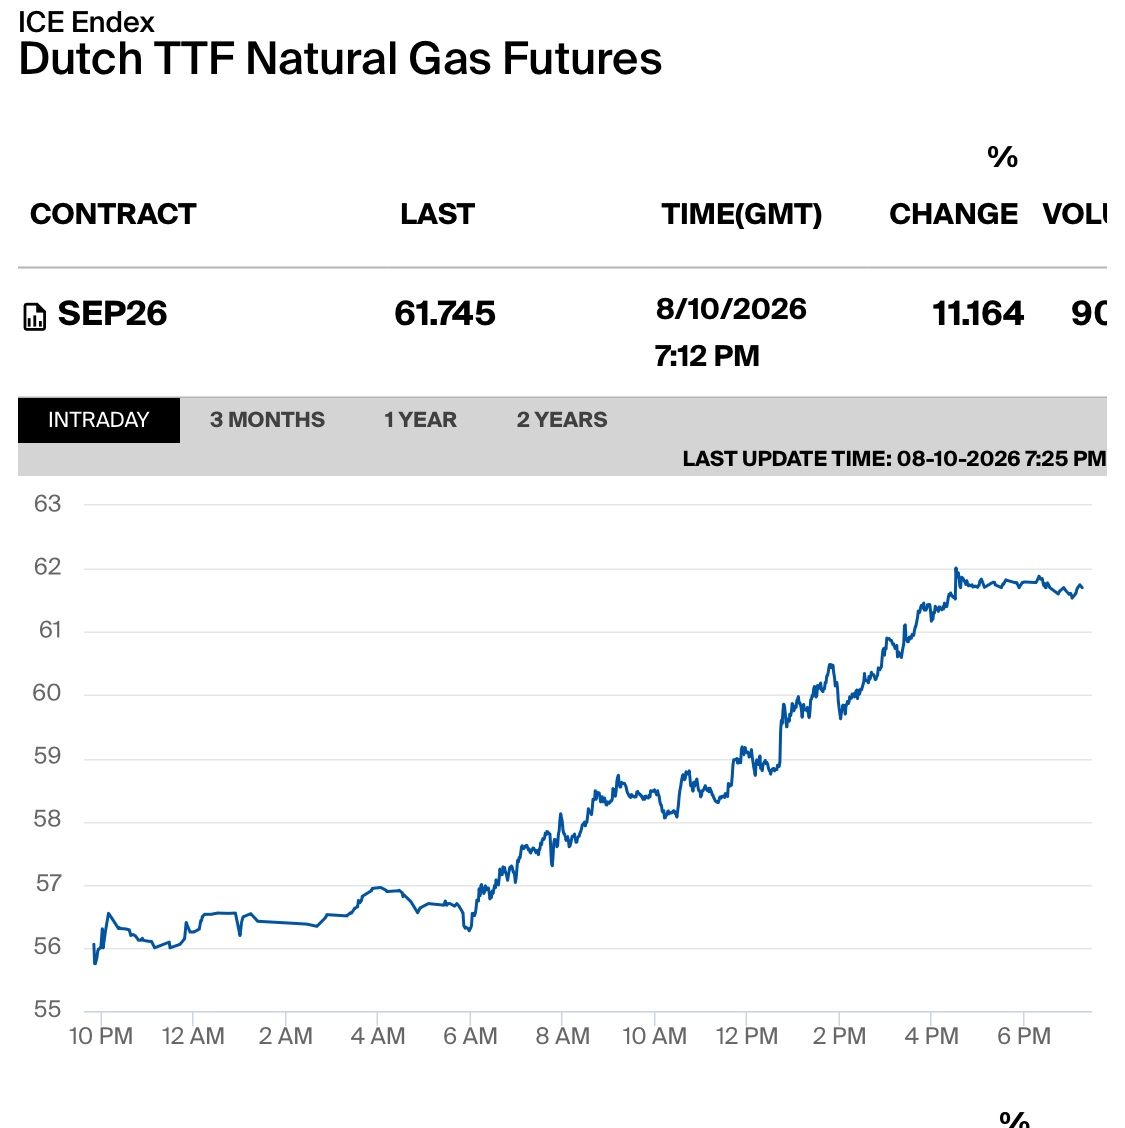
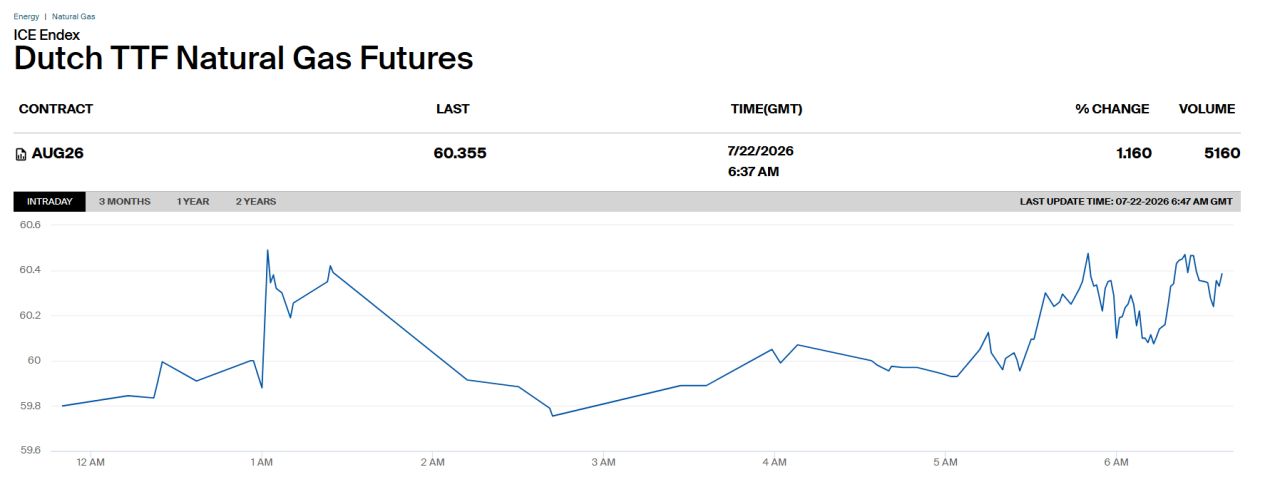
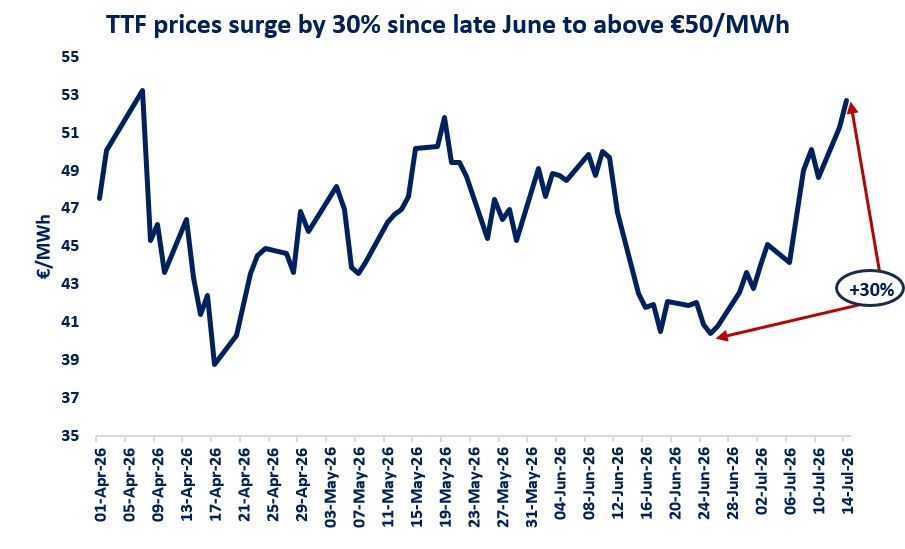
It’s a bear necessity: TTF prices fell by almost 20% since mid-September, when a heavy bull run drove up Asian and Europe gas prices close to $30/mmbtu, their highest levels since Dec22.
What is driving the current bearish trend and is it really structural?
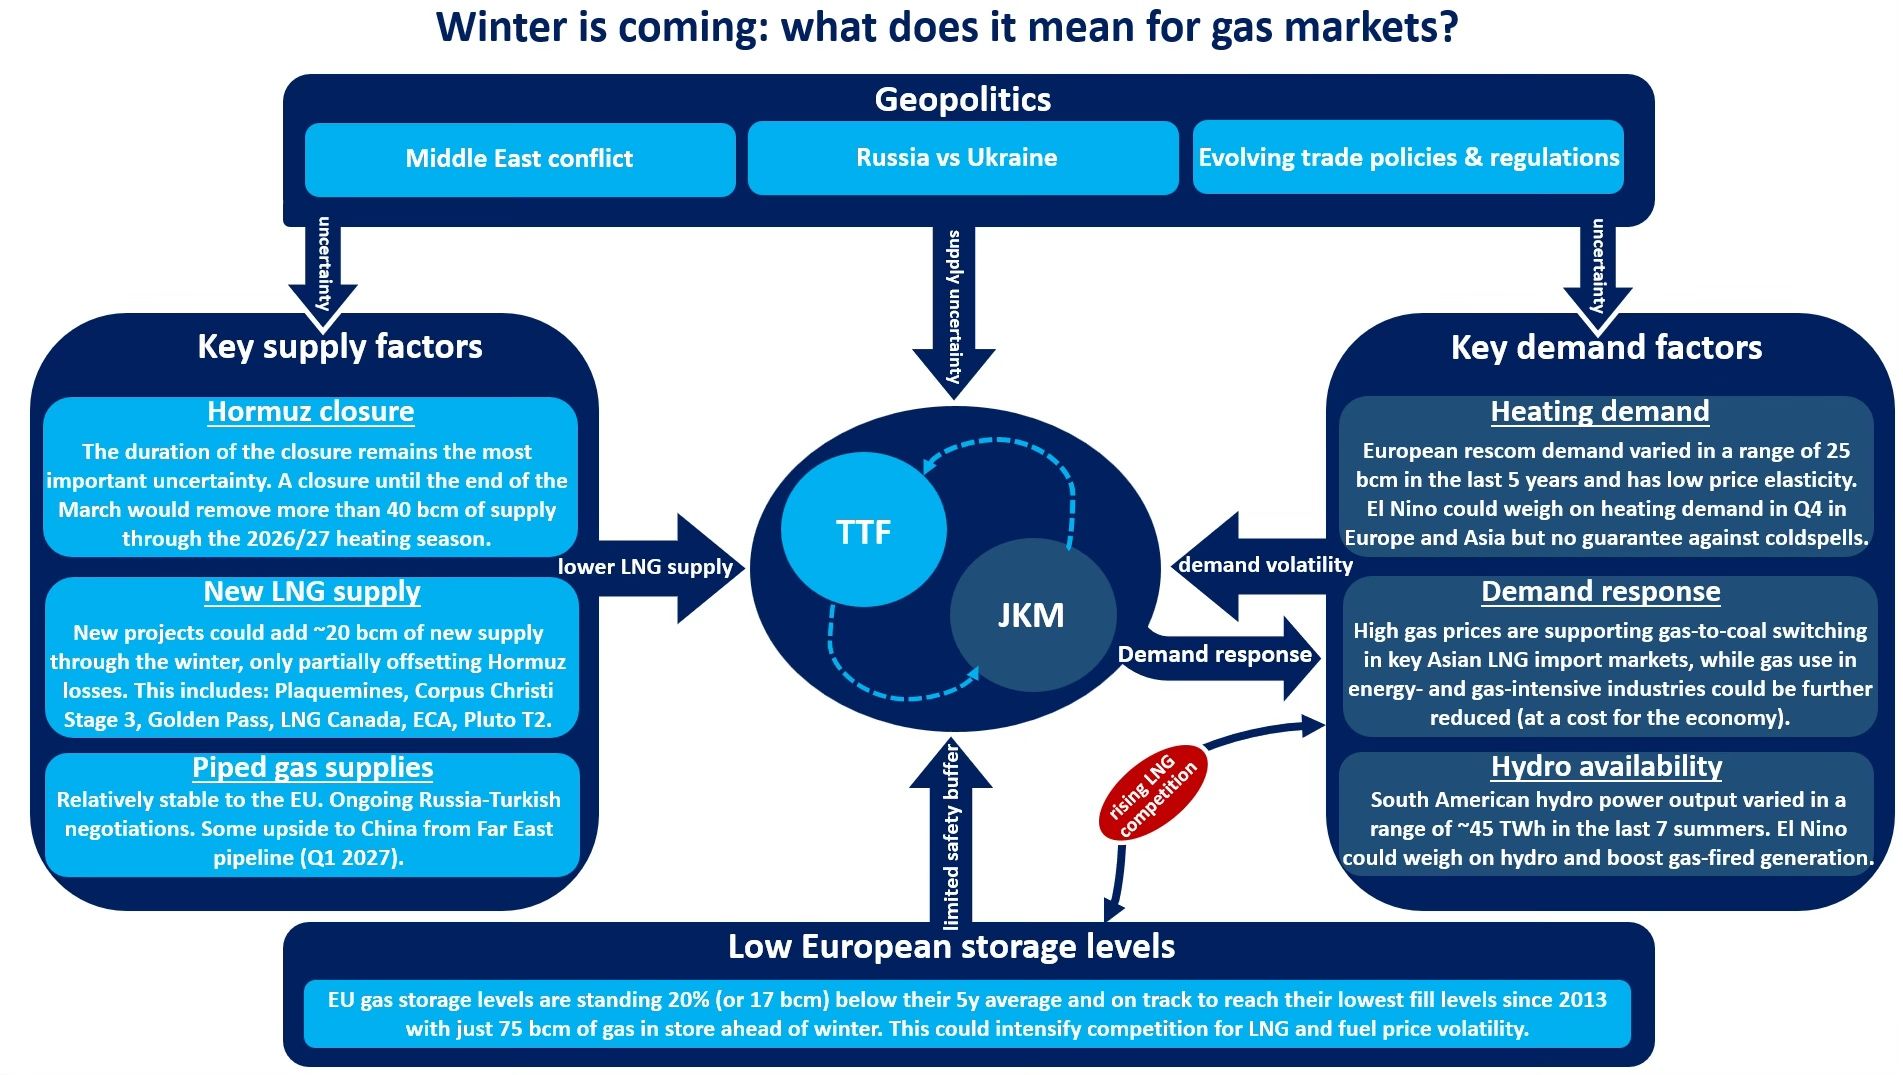
(1) Peace talks: reemergence of negotiations on the Strait of Hormuz and on broader peace in the Middle East are the primary drivers behind the fall in gas prices. A key question if the positions of parties really changed.
(2) Hormuz flows: after a full stop in August, around 12 LNG carriers passed through the Strait and 13 LNG carriers went dark (no signal), which might indicate that they are preparing for the risky transit.
(3) Profit-taking: some players might want to cash-in after the wild Aug-Sep bull run, when TTF prices surged by more than 50%. But this is just the usual cycle.
(4) Still feels like summer: expectations on a milder and windier Oct/Nov might be also contributing to the overall downward pressure on prices as well as reduced demand from the power and industrial sectors (demand response due to high prices).
What is your view? Are the bears back in the game? Or bulls are still full of steam?