European gas market faces asymmetric winter price risk

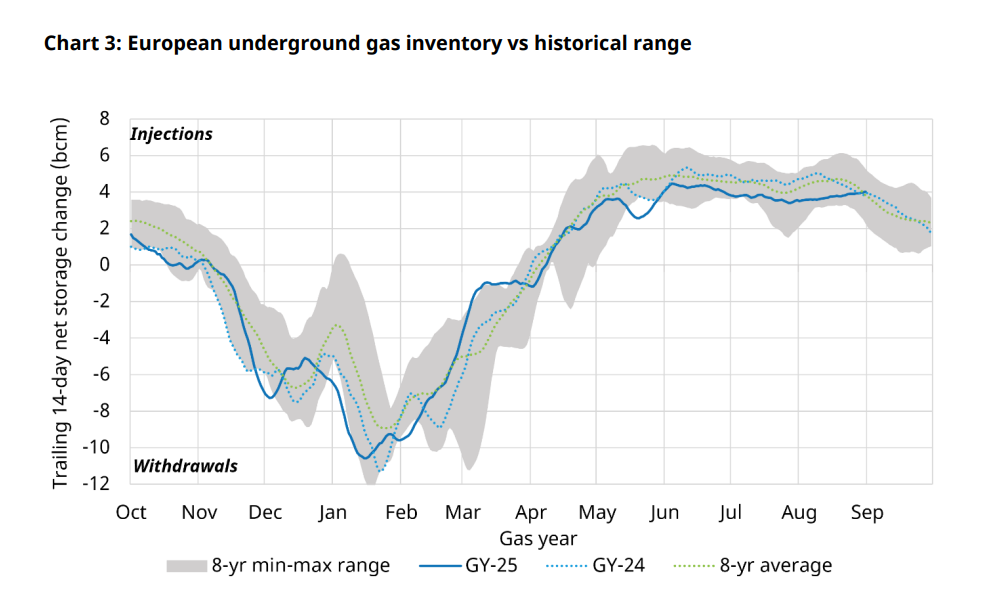
Chart showing European underground gas inventory over Oct–Sep. Shaded gray area = 8-year min–max range; blue solid line = GY-25; blue dotted line = GY-24; green dotted line = 8-year average. Y-axis shows trailing 14-day net storage change (bcm) from -12 to +8; X-axis months Oct–Sep. The graph depicts seasonal fluctuations with deepest negative change around January and recovery to positive changes by mid-year, peaking around Jun–Jul.

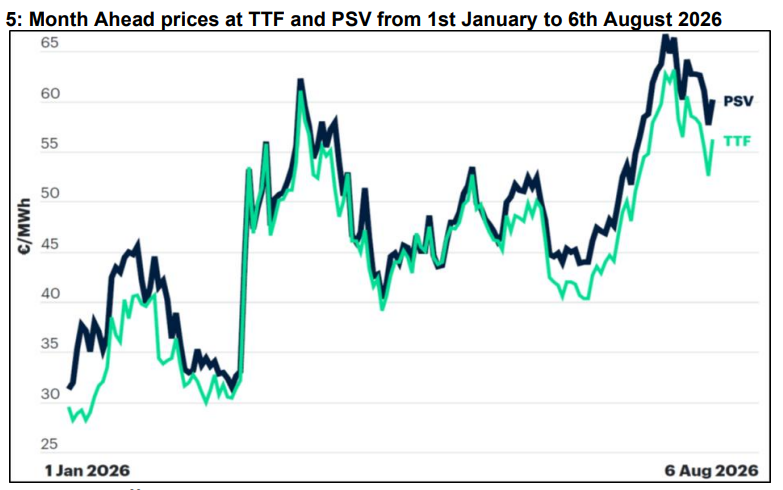
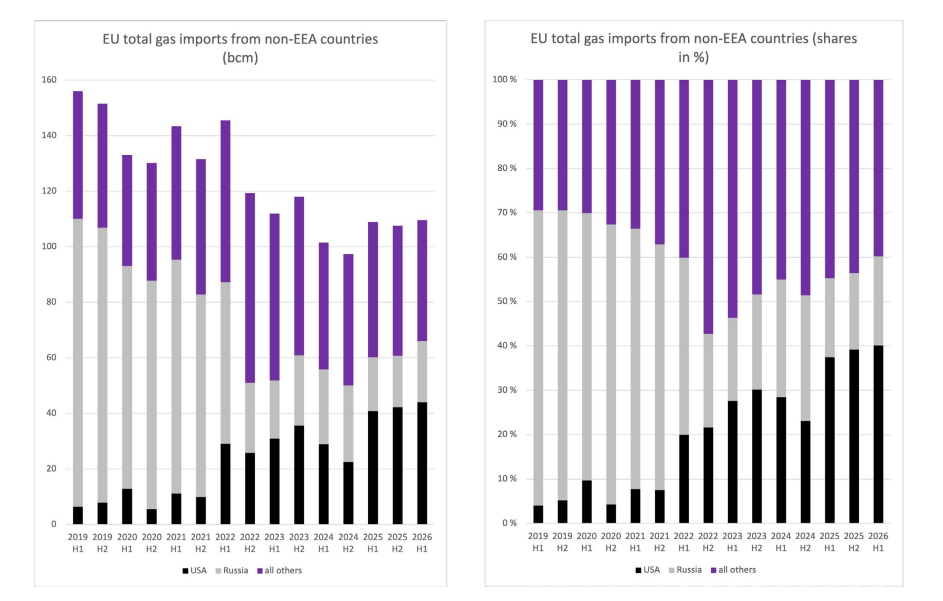
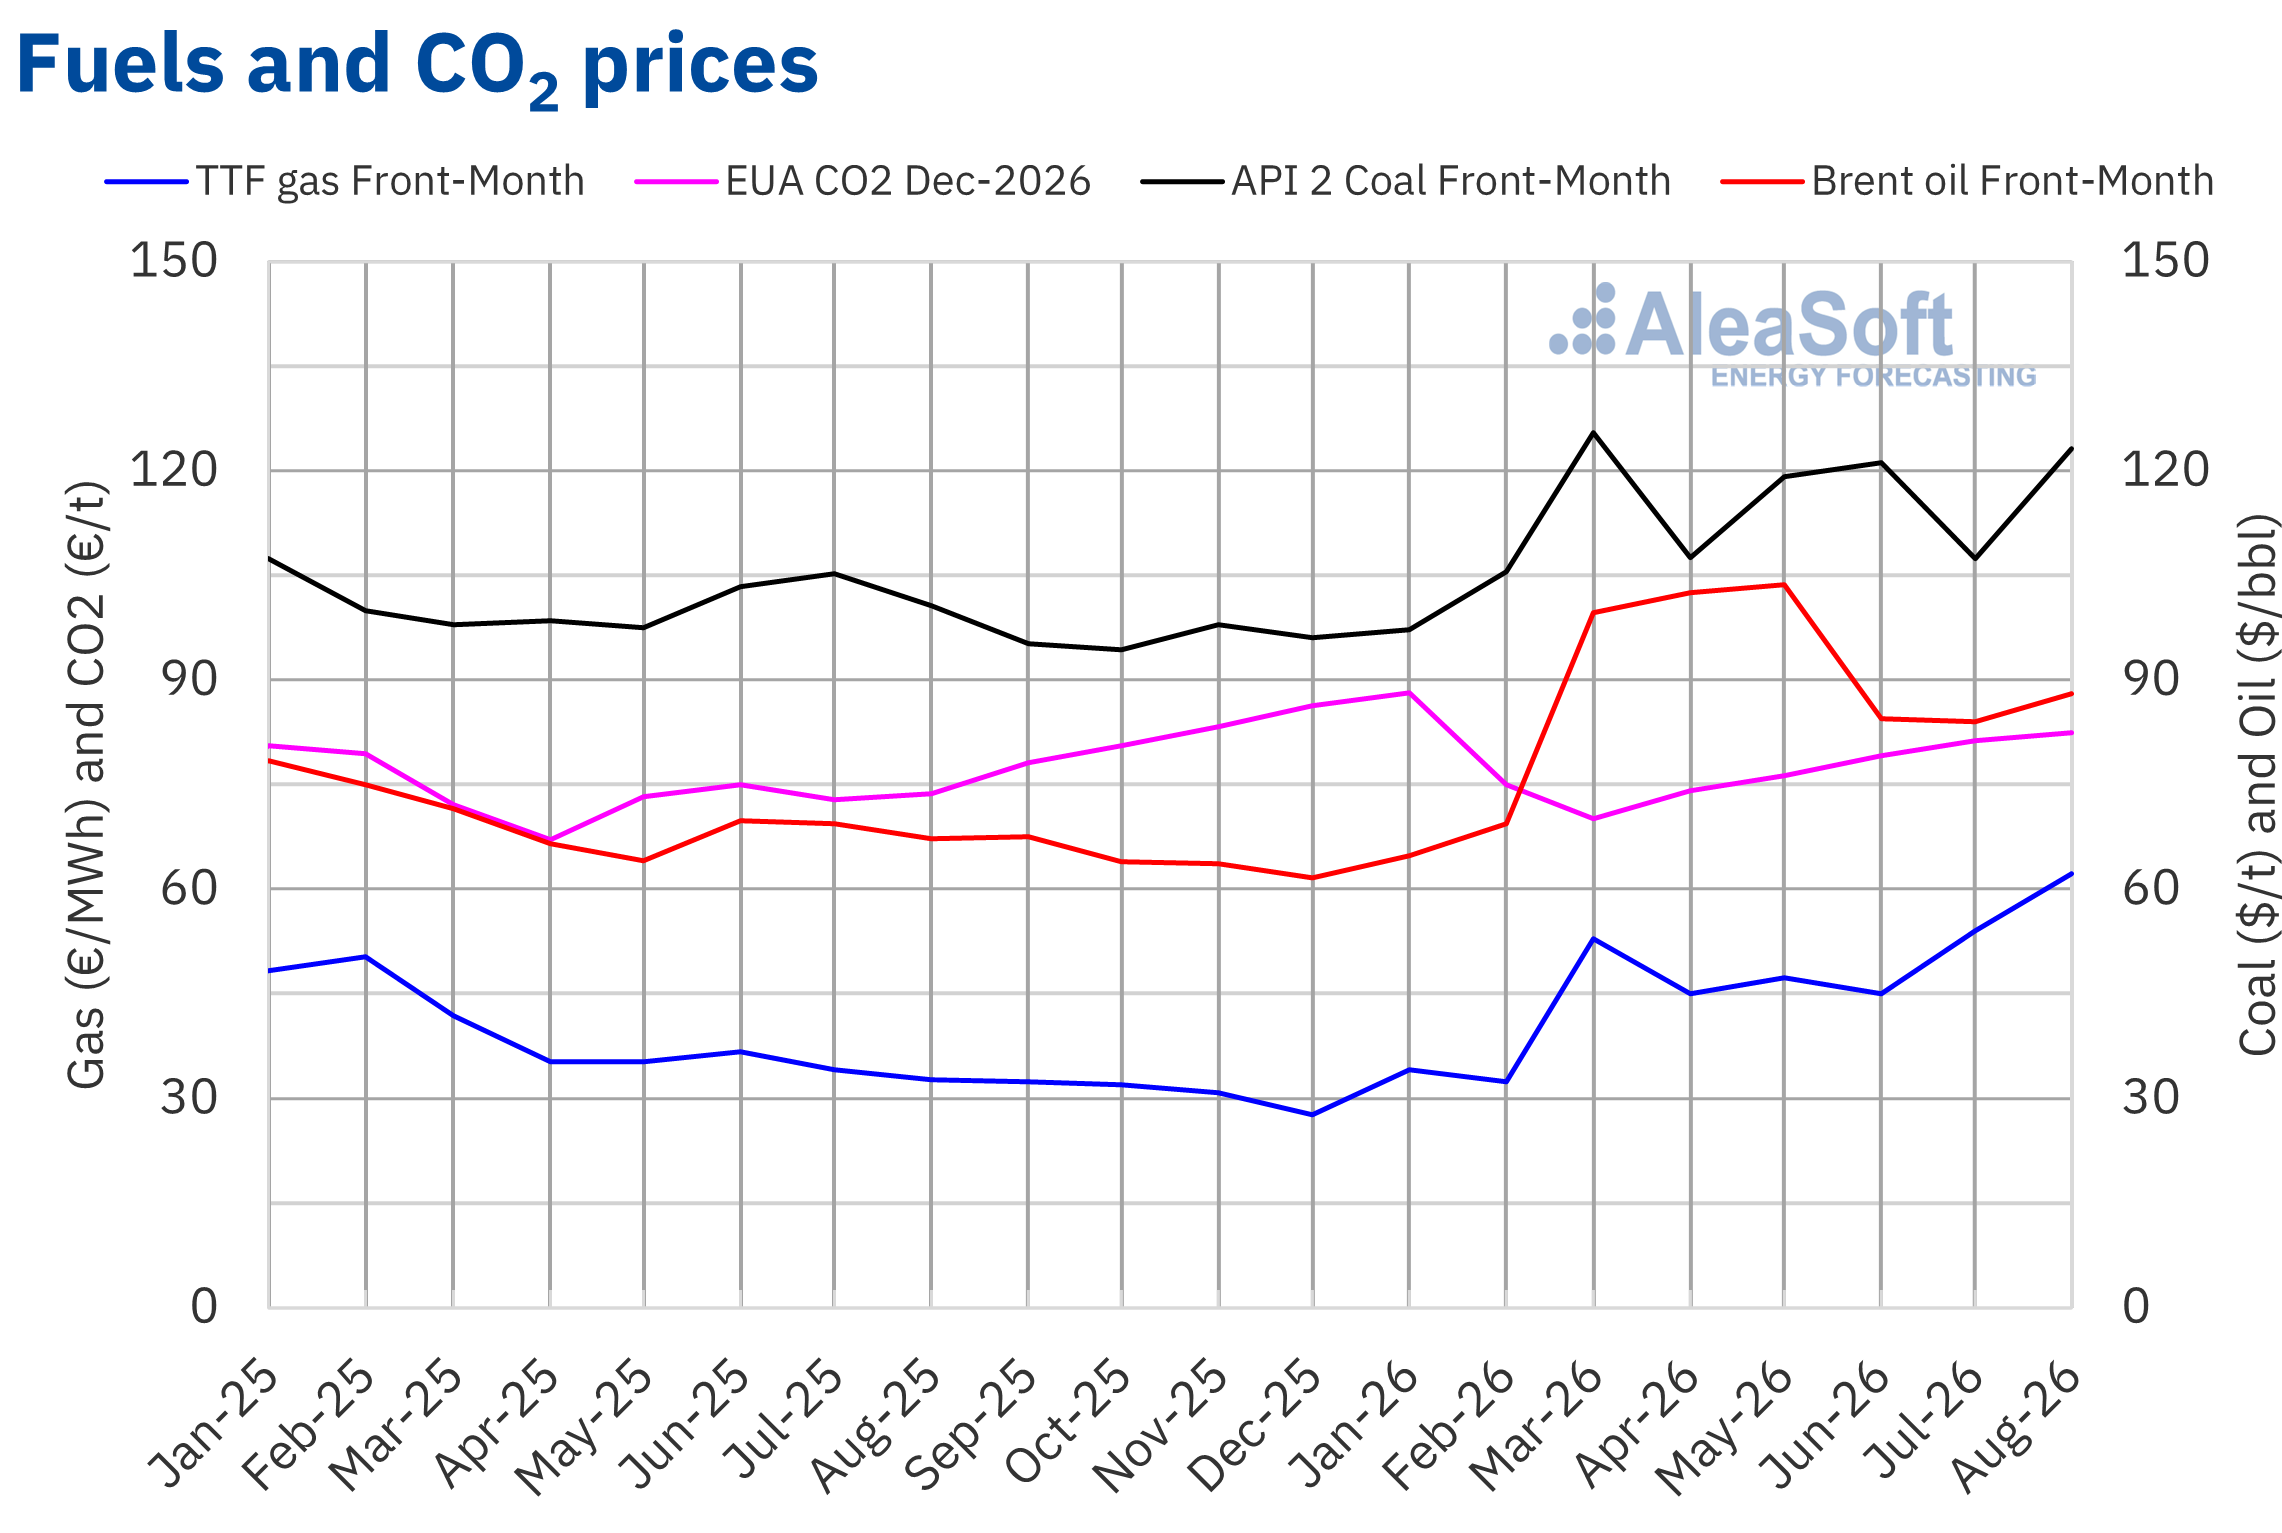
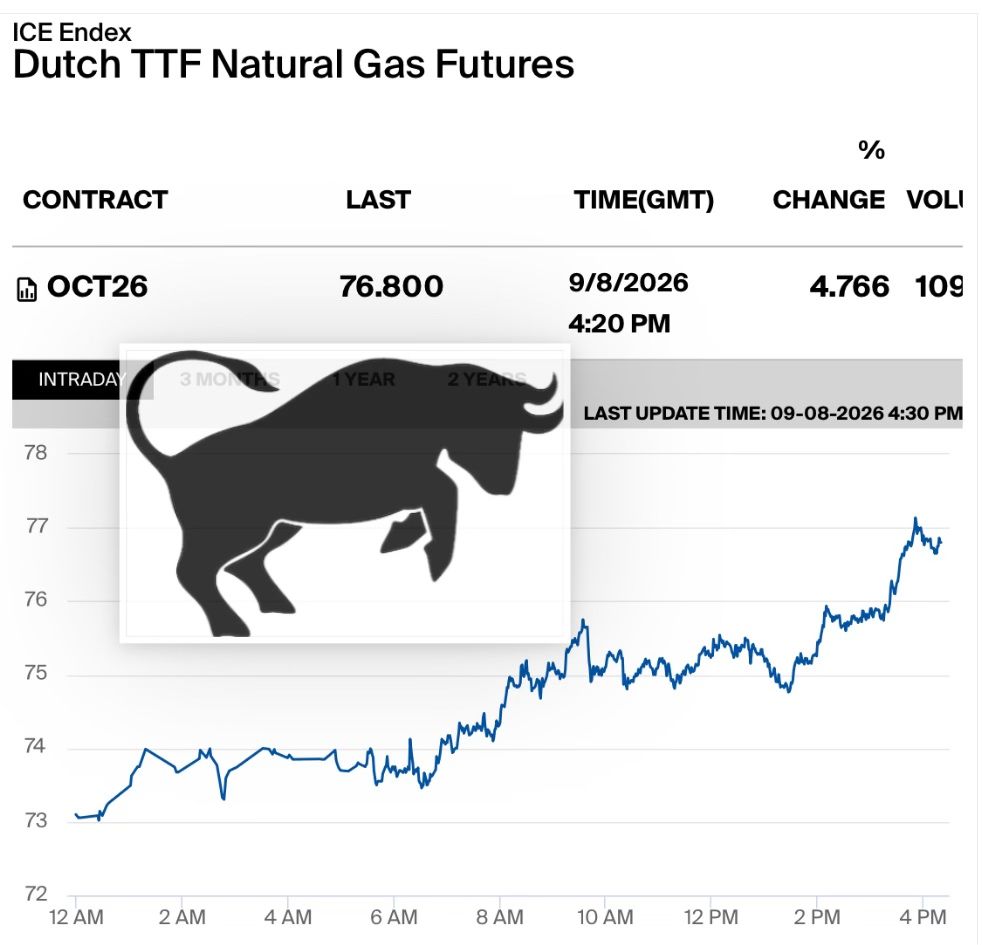
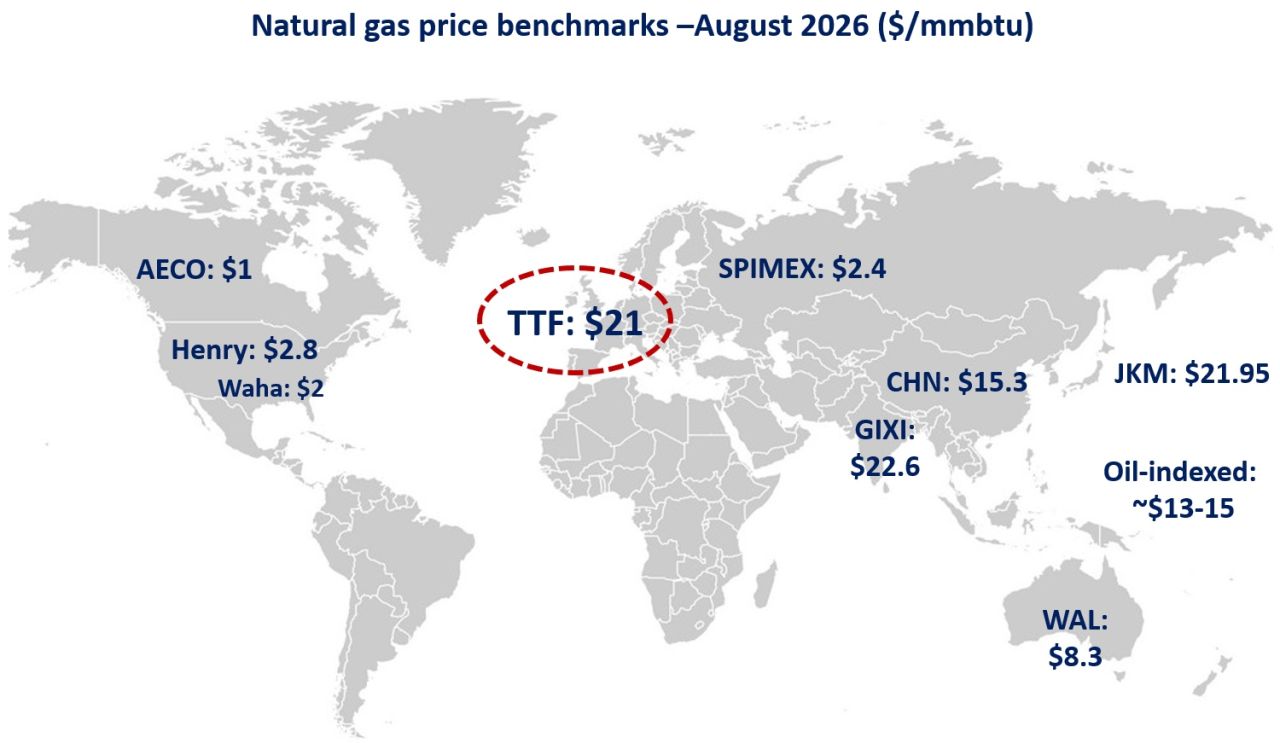
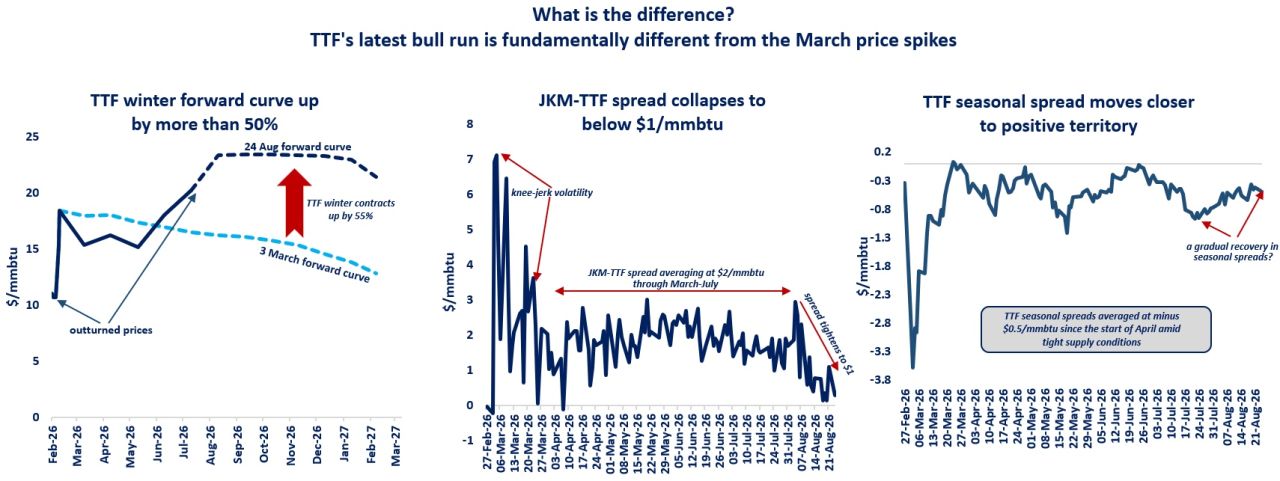
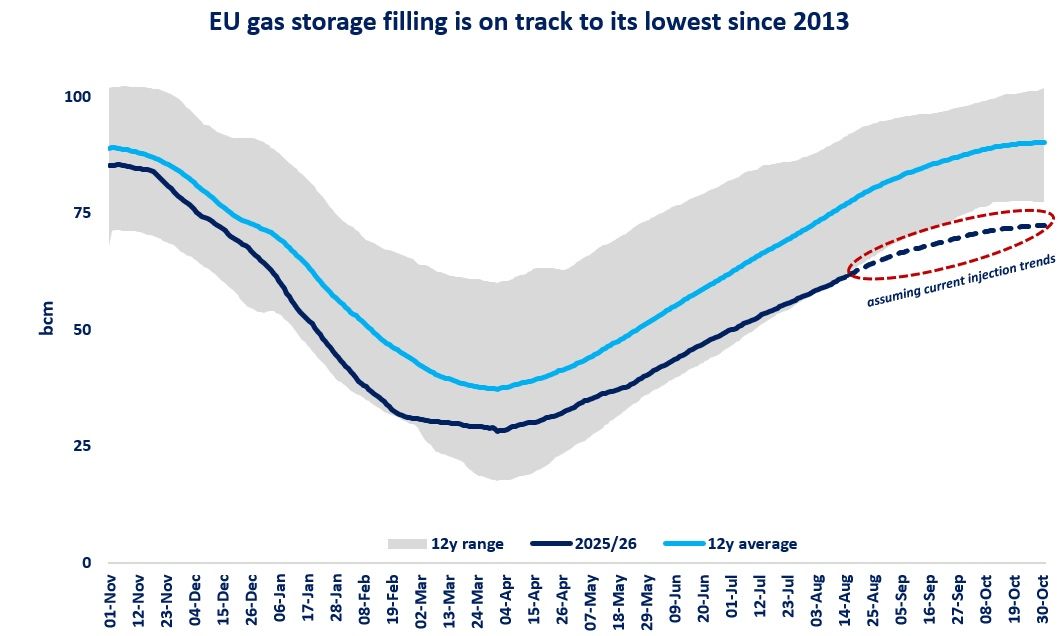
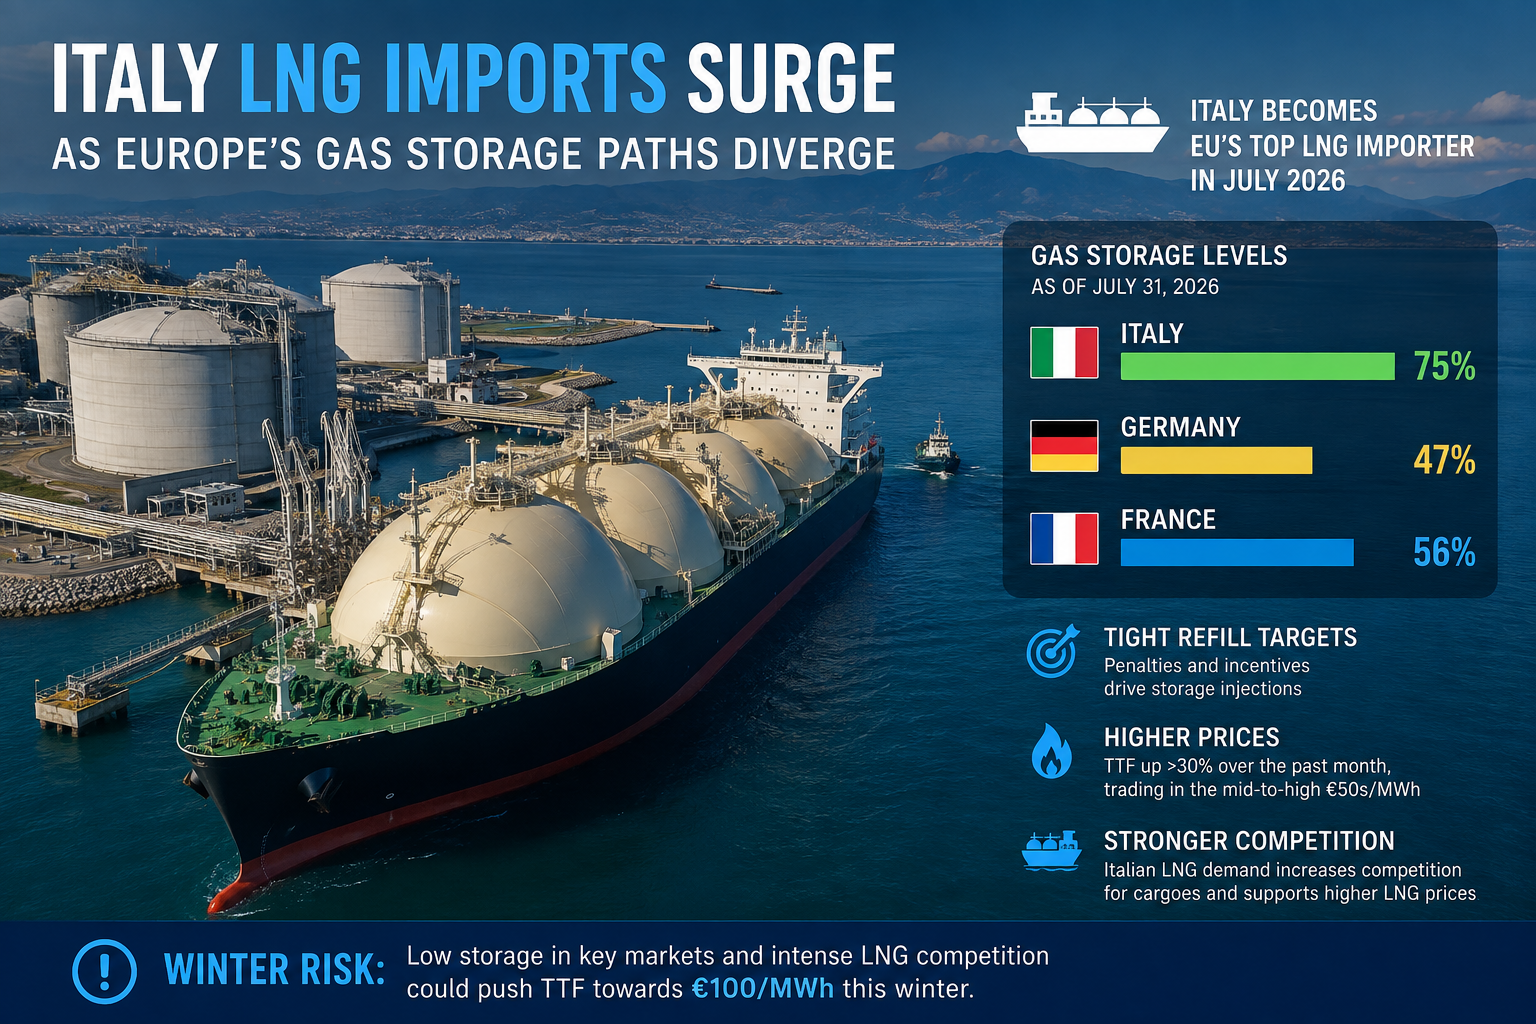
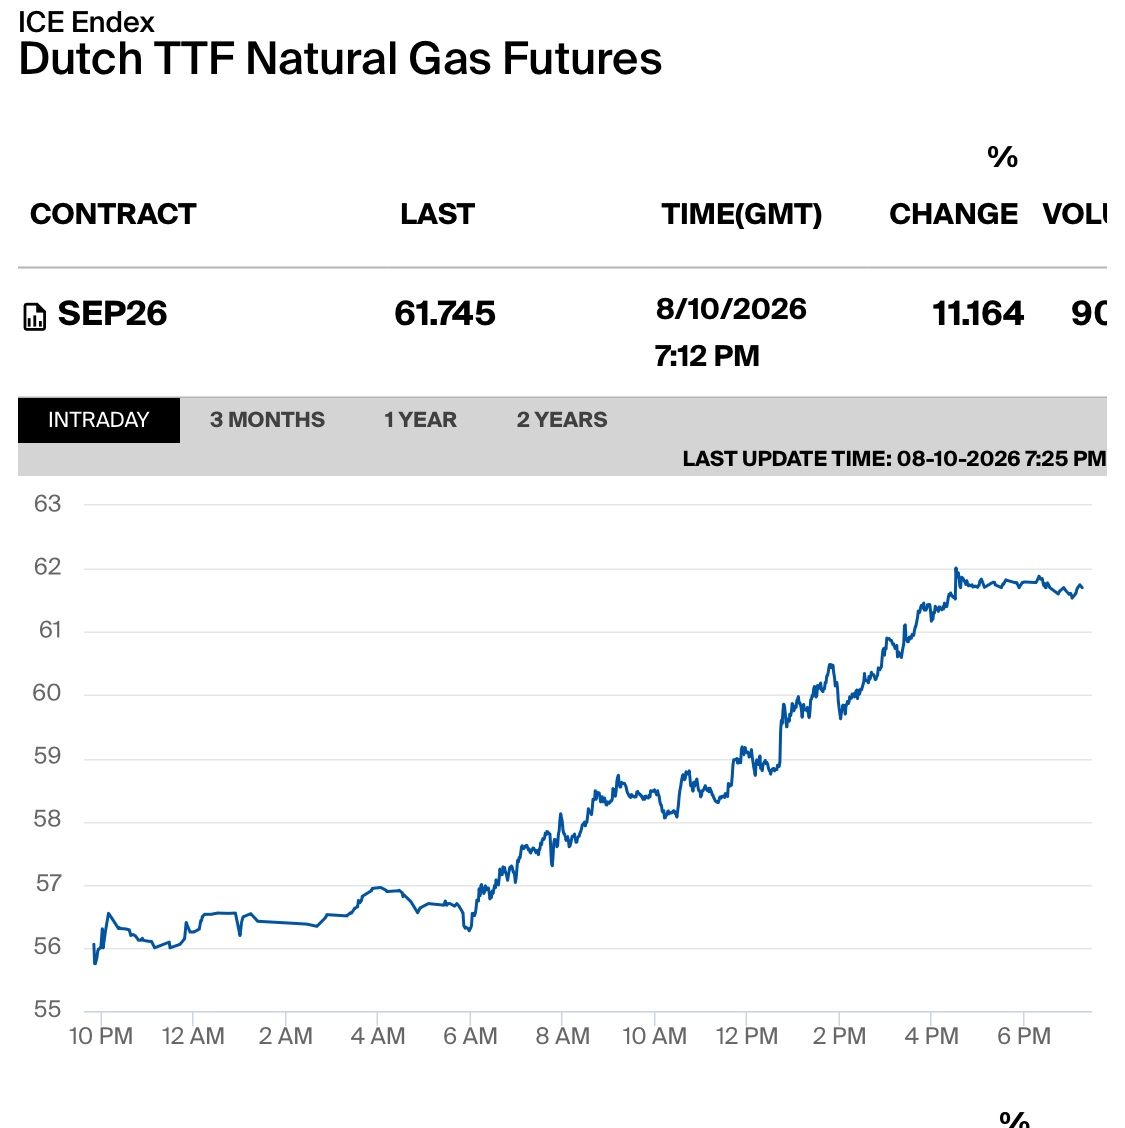
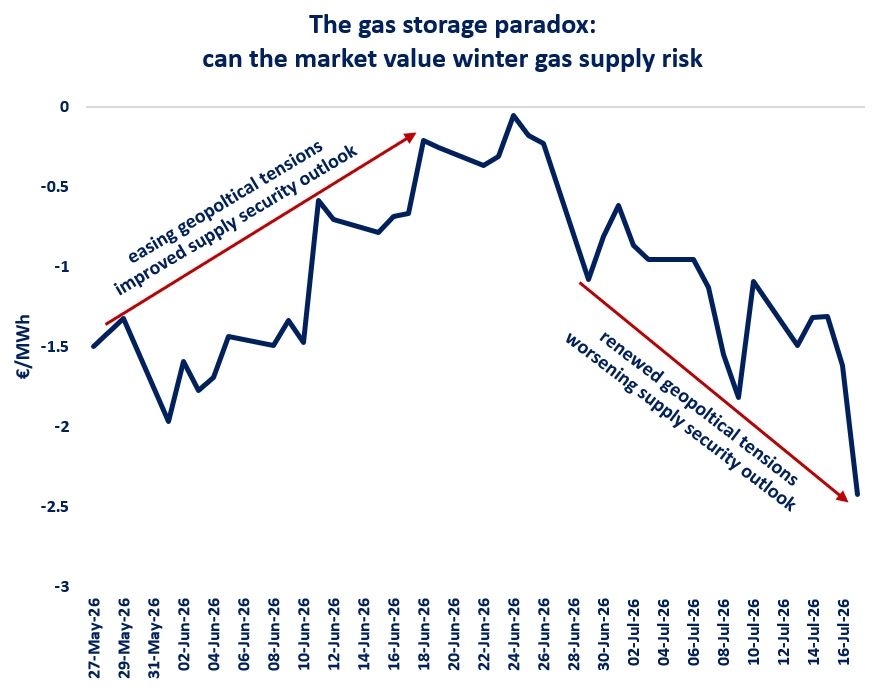
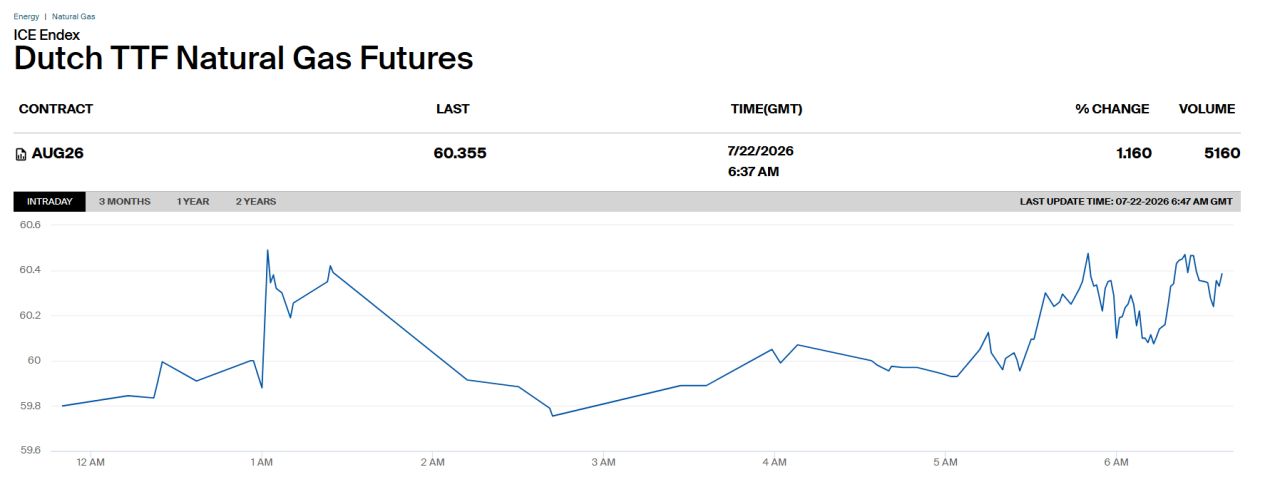
The European gas market is heading towards winter with unusually low storage inventories and limited capacity to absorb further supply disruptions. This five-chart briefing examines how the prolonged loss of LNG supply through the Strait of Hormuz is reshaping global flows, demand and prices. European and Asian gas prices have climbed sharply as the market adjusts to a longer-lasting disruption […]

This report is premium content Start a FREE 30-day trial to read this report and unlock our full library of 2,600+ natural gas reports, white papers, and market studies. You’ll receive weekly content updates — and you can cancel anytime during the trial if it’s not for you.
FREE TRIAL
Already a subscriber ? Log in
RELATED POSTS