Skip to content
European-Gas-Hub-Logo
X-twitter Linkedin Youtube
  • Home
  • Premium Content
  • Insights
  • Events
  • Industry Links
    • Industry Association
    • Research Institute / Think Tank
    • Regulatory Body
    • Government Body
    • Consultant
    • Gas Prices
  • About Us
  • Other Hubs
    • GLOBAL LNG HUB
    • GLOBAL MARITIME HUB
    • THE COAL HUB
    • GLOBAL HYDROGEN HUB
    • GLOBAL MINERALS HUB
  • FREE TRIAL
  • My account
  • Login
€0.00 0 Cart
European-Gas-Hub-Logo
€0.00 0 Cart
  • Home
  • Premium Content
  • Insights
  • Events
  • Industry Links
    • Industry Association
    • Research Institute / Think Tank
    • Regulatory Body
    • Government Body
    • Consultant
    • Gas Prices
  • About Us
  • Other Hubs
    • GLOBAL LNG HUB
    • GLOBAL MARITIME HUB
    • THE COAL HUB
    • GLOBAL HYDROGEN HUB
    • GLOBAL MINERALS HUB
  • FREE TRIAL
  • My account
  • Login
X-twitter Linkedin Youtube

© 2025 EuropeanGasHub | All Rights Reserved

Tag: renewables

Chart comparing Spain’s electricity prices and gas power costs during 2021–2022 and 2025–2026

Spain’s power market shows growing decoupling of electricity and natural gas prices

  • June 24, 2026
Chart showing gas-fired power generation share falling globally as renewables increase

Gas-fired power generation loses share as renewables meet rising electricity demand

  • June 9, 2026
UK energy policy image showing gas, renewables, nuclear power and high energy prices

UK energy policy and the growing cost of Britain’s energy transition

  • June 9, 2026
Chart comparing Germany’s 2026 electricity costs by generation technology

European power generation costs challenge assumptions about renewables

  • June 2, 2026
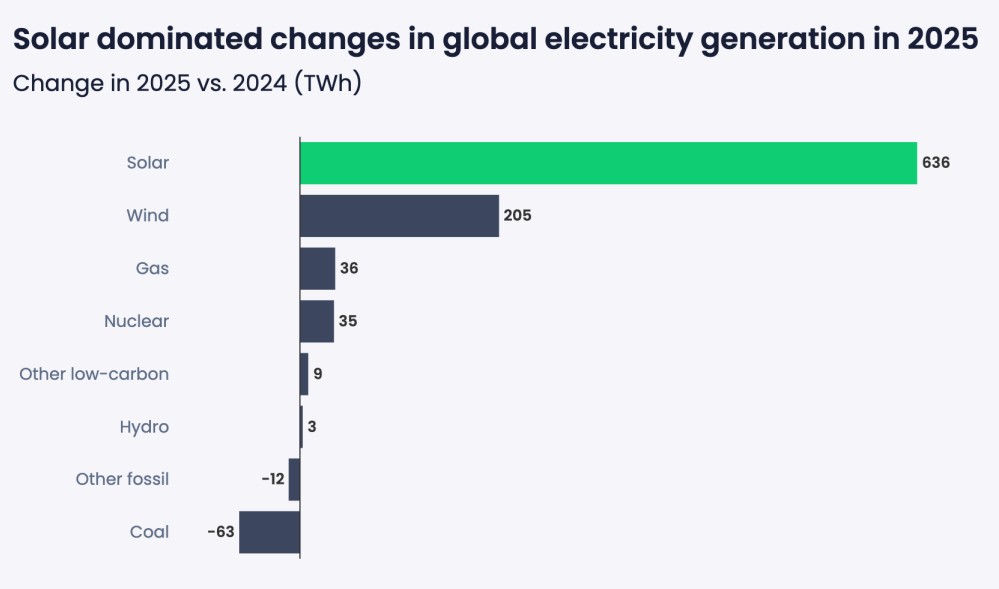
Bar chart of 2025 vs 2024 changes in global electricity generation (TWh): Solar +636, Wind +205, Gas +36, Nuclear +35, Other low-carbon +9, Hydro +3, Other fossil −12, Coal −63.

Falling European gas demand underlines structural changes in the power generation market

  • April 28, 2026
Chart showing average annual change in global gas demand by region from 2004 to 2025 with slowdown in 2025

Global gas demand growth slows as clean energy reshapes energy markets

  • April 28, 2026
Line chart showing global greenhouse gas emissions comparing delayed transition and central scenarios with temperature outcomes

Slower energy transition lifts gas demand in European power markets

  • April 21, 2026
Chart showing Spain’s wholesale electricity price gap versus the European median alongside rising wind and solar share, highlighting Spain energy shift and renewable resilience.

Spain energy shift boosts renewable resilience in Europe

  • April 14, 2026
Stacked area chart showing EU-27 gas imports by country of origin from 2020 to 2025, with Russia’s share falling and Norway and the United States increasing.

European gas imports remain a key energy security challenge for the EU

  • April 14, 2026
Bar chart showing Germany’s LNG imports from 2023 to 2025, highlighting rising import volumes and growing dependence on US LNG.

Germany gas dependence raises energy security risks

  • April 7, 2026
Previous Page1 Page2 Page3 … Page10 Next
Recent Post
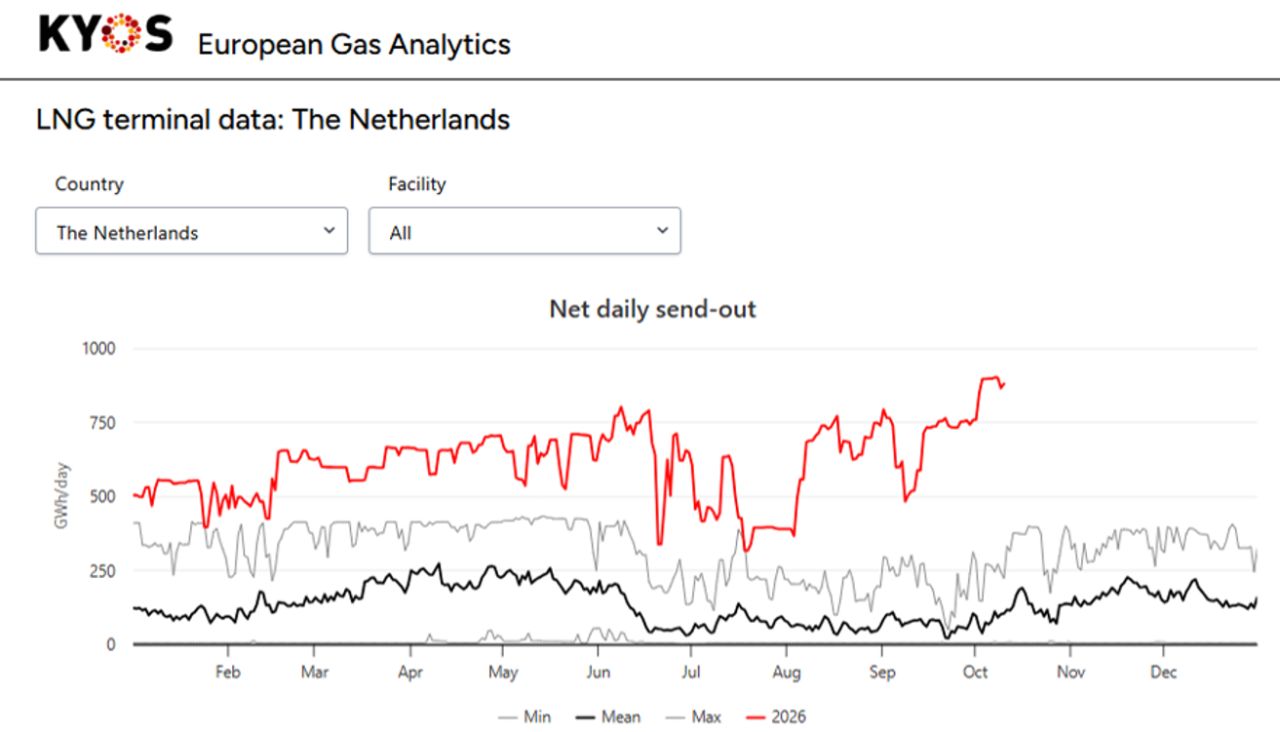
Dutch gas storage and LNG send-out trends showing increased LNG imports in 2026 compared with historical levels.

Dutch gas storage relies increasingly on LNG flexibility ahead of winter

October 21, 2026
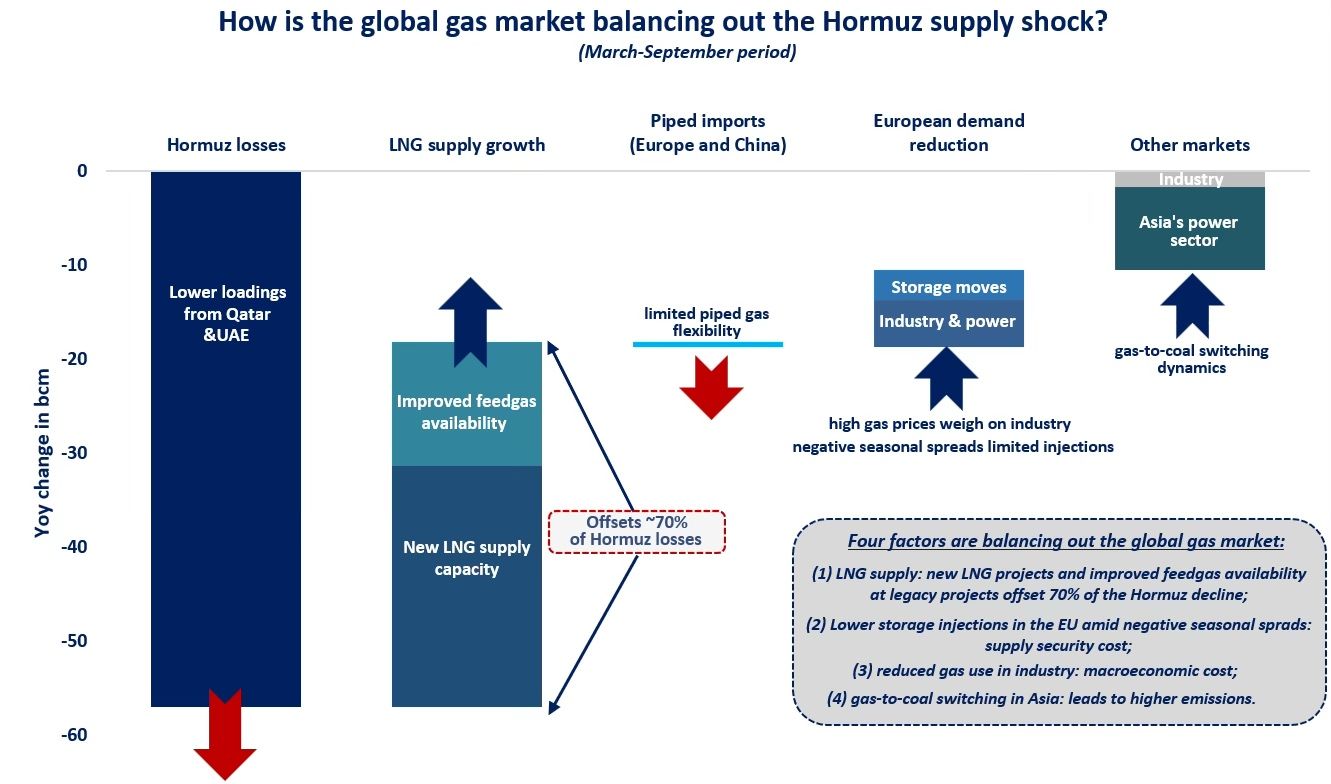
Chart showing how LNG supply growth, lower EU storage injections, reduced industrial demand and Asian gas-to-coal switching offset the Hormuz supply shock.

Global gas market faces a difficult balancing act ahead of winter

October 14, 2026
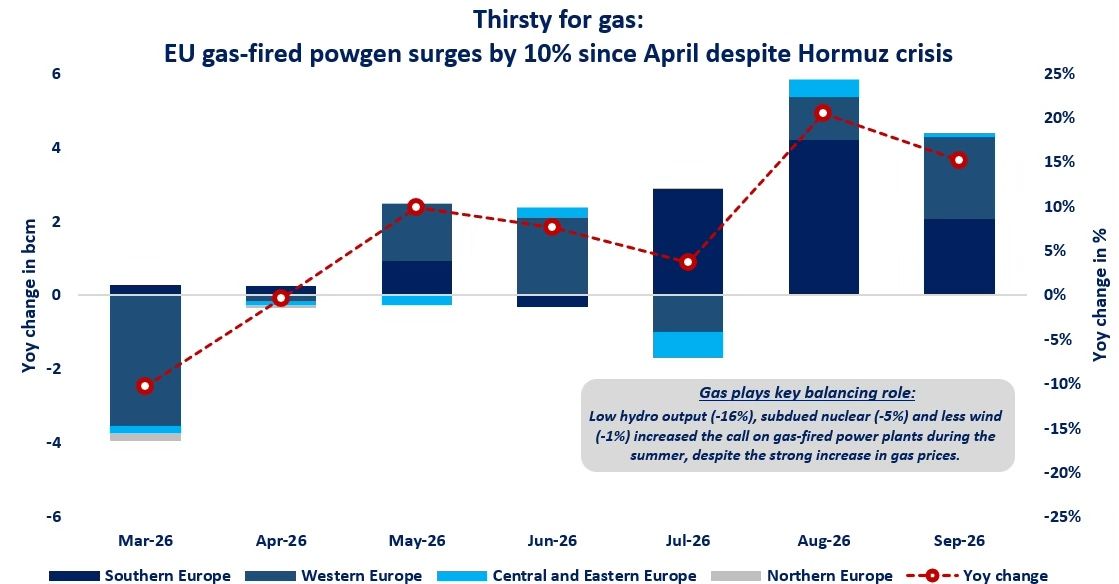
Chart showing monthly year-on-year changes in EU gas use for power generation, March–September 2026, with growth since April despite higher gas prices.

Gas-fired power rises in the EU despite higher gas prices

October 6, 2026
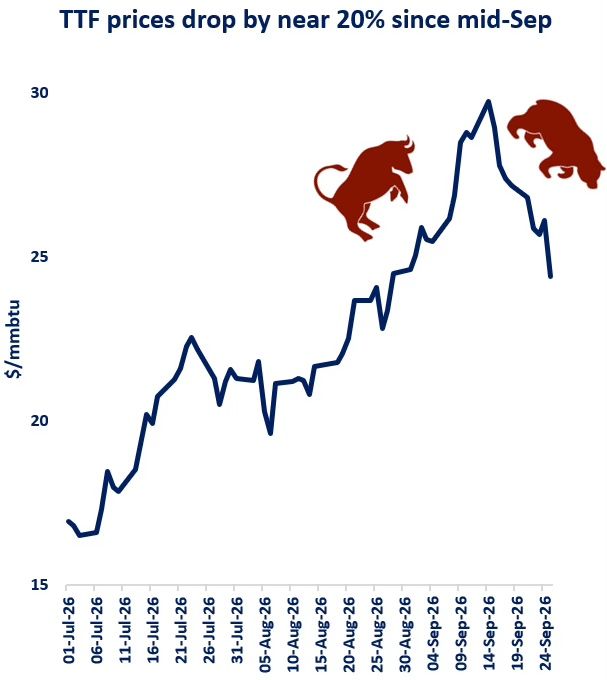
Line chart of TTF gas prices ($/mmBtu) from July to late September 2026, peaking around 30 and dropping about 20% since mid-September, with decorative red bulls on the chart.

TTF prices down almost 20% as bearish pressures build

September 30, 2026
Trending Posts
LNG trade value to grow by 50%

LNG trade value to grow by 50%

May 3, 2021
gas-prices

Will spot and month-ahead gas prices reconnect?

October 18, 2022
European gas prices

European gas demand jumps to record highs

May 4, 2021
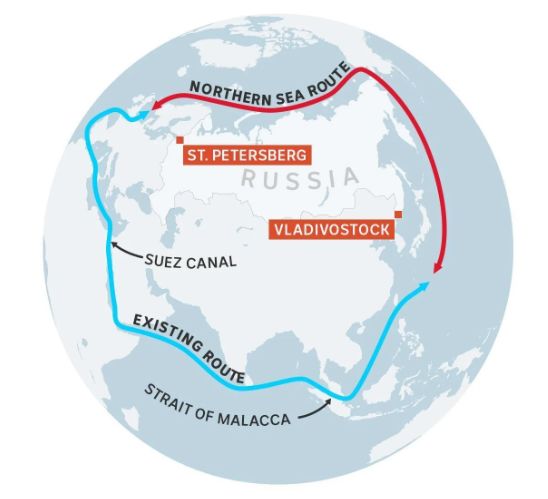
Map showing the Northern Sea Route linking Russian LNG export terminals with Asian markets, compared with the traditional shipping route via the Suez Canal and Strait of Malacca.

Russian LNG cargoes reach Asia earlier amid Hormuz disruption

June 2, 2026
European-Gas-Hub-Logo

European gas market intelligence platform featuring 2,600+ reports, presentations and industry insights, with new content added every week. more info

Categories

  • European Gas Prices
  • Energy Policy
  • European Gas Infrastructure
  • European Gas Storage
  • Coal Market
  • Supply & Demand
  • LNG
  • European Power Generation
  • Hydrogen
  • Russia
  • Unconventional Resources
  • Other

Recent Analysis

Dutch gas storage relies increasingly on LNG flexibility ahead of winter

Global gas market faces a difficult balancing act ahead of winter

Gas-fired power rises in the EU despite higher gas prices

Weekly Updates

Sign up to receive our weekly newsletter with new European gas market reports, presentations & analysis. Every Tuesday.

Your subscription could not be saved. Please try again.
Your subscription has been successful.

By signing up, I agree to our TOS and Privacy Policy.

© 2026 EuropeanGasHub | All Rights Reserved

X-twitter Linkedin Youtube
Manage Consent
To provide the best experiences, we use technologies like cookies to store and/or access device information. Consenting to these technologies will allow us to process data such as browsing behavior or unique IDs on this site. Not consenting or withdrawing consent, may adversely affect certain features and functions.
Functional Always active
The technical storage or access is strictly necessary for the legitimate purpose of enabling the use of a specific service explicitly requested by the subscriber or user, or for the sole purpose of carrying out the transmission of a communication over an electronic communications network.
Preferences
The technical storage or access is necessary for the legitimate purpose of storing preferences that are not requested by the subscriber or user.
Statistics
The technical storage or access that is used exclusively for statistical purposes. The technical storage or access that is used exclusively for anonymous statistical purposes. Without a subpoena, voluntary compliance on the part of your Internet Service Provider, or additional records from a third party, information stored or retrieved for this purpose alone cannot usually be used to identify you.
Marketing
The technical storage or access is required to create user profiles to send advertising, or to track the user on a website or across several websites for similar marketing purposes.
  • Manage options
  • Manage services
  • Manage {vendor_count} vendors
  • Read more about these purposes
View preferences
  • {title}
  • {title}
  • {title}