Skip to content
European-Gas-Hub-Logo
X-twitter Linkedin Youtube
  • Home
  • Premium Content
  • Insights
  • Events
  • Industry Links
    • Industry Association
    • Research Institute / Think Tank
    • Regulatory Body
    • Government Body
    • Consultant
    • Gas Prices
  • About Us
  • Other Hubs
    • GLOBAL LNG HUB
    • GLOBAL MARITIME HUB
    • THE COAL HUB
    • GLOBAL HYDROGEN HUB
    • GLOBAL MINERALS HUB
  • FREE TRIAL
  • My account
  • Login
€0.00 0 Cart
European-Gas-Hub-Logo
€0.00 0 Cart
  • Home
  • Premium Content
  • Insights
  • Events
  • Industry Links
    • Industry Association
    • Research Institute / Think Tank
    • Regulatory Body
    • Government Body
    • Consultant
    • Gas Prices
  • About Us
  • Other Hubs
    • GLOBAL LNG HUB
    • GLOBAL MARITIME HUB
    • THE COAL HUB
    • GLOBAL HYDROGEN HUB
    • GLOBAL MINERALS HUB
  • FREE TRIAL
  • My account
  • Login
X-twitter Linkedin Youtube

© 2025 EuropeanGasHub | All Rights Reserved

Tag: gas value chain

Renewable and low carbon gas in Europe

  • December 21, 2021

Greenhouse gas and methane intensities along the Norwegian gas value chain

  • December 8, 2021
European gas infrastructure

Nord Stream2 Decision: based on alternative facts & hypocrisy?

  • January 11, 2021

Global Energy & Gas Outlook

  • May 6, 2019
Wolfgang peter gas markets

The Gas Value Chain Company GmbH

  • March 27, 2018
Recent Post
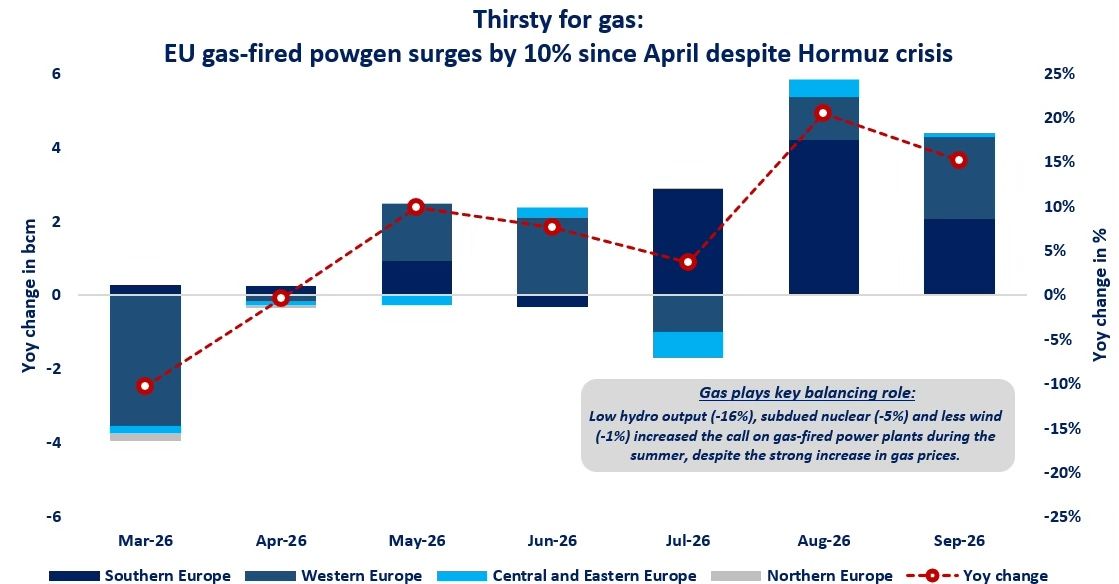
Chart showing monthly year-on-year changes in EU gas use for power generation, March–September 2026, with growth since April despite higher gas prices.

Gas-fired power rises in the EU despite higher gas prices

October 6, 2026
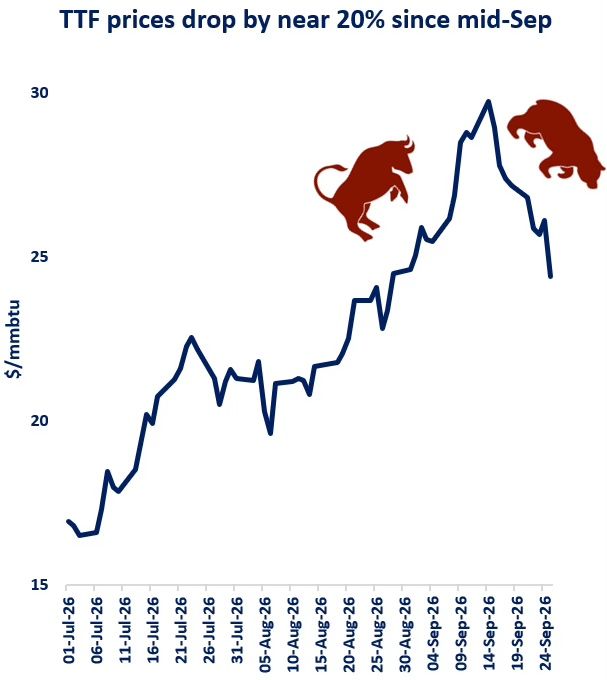
Line chart of TTF gas prices ($/mmBtu) from July to late September 2026, peaking around 30 and dropping about 20% since mid-September, with decorative red bulls on the chart.

TTF prices down almost 20% as bearish pressures build

September 30, 2026
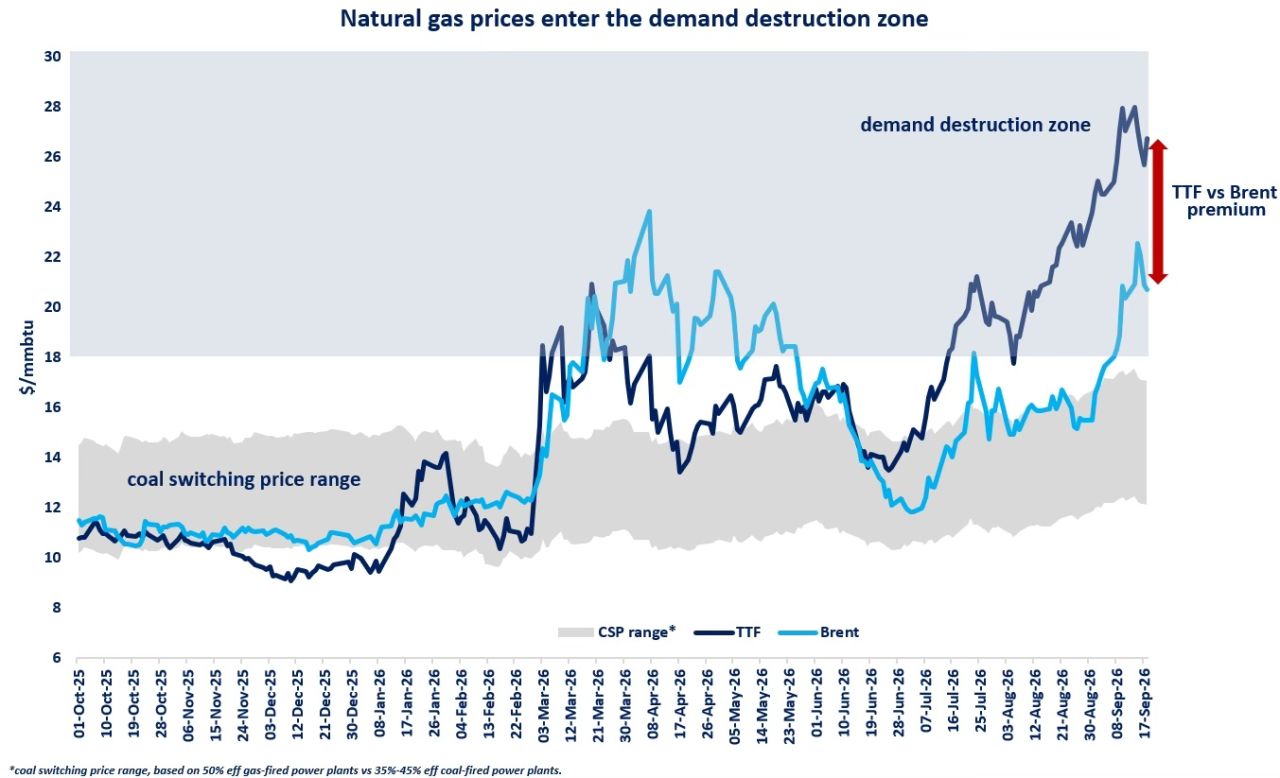
Line chart comparing TTF gas and Brent oil prices from October 2025 to September 2026, with TTF rising into the gas demand destruction zone.

Gas demand destruction emerges as European gas prices surge

September 23, 2026
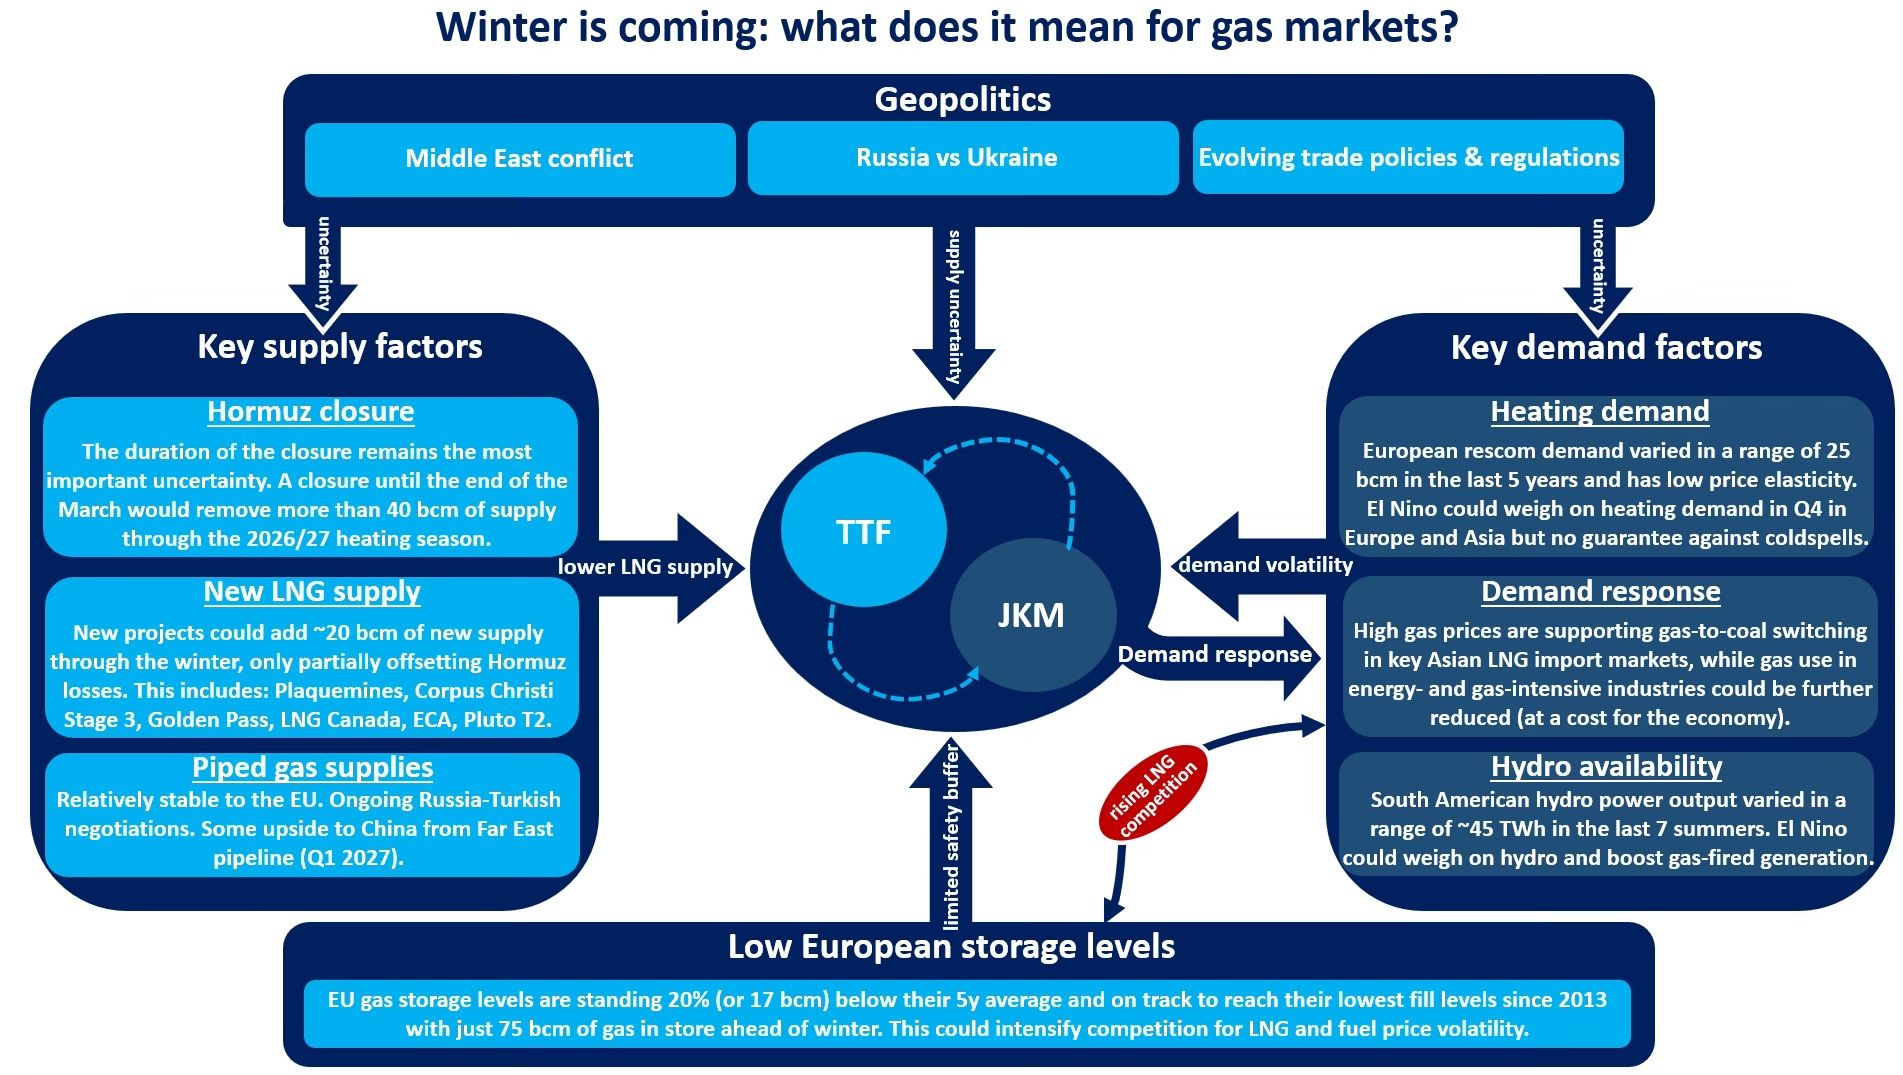
Winter gas markets outlook showing supply, demand and European storage risks

Winter gas markets face unprecedented uncertainty as Hormuz closure tightens supply

September 16, 2026
Trending Posts

January: new records for European LNG sendouts

February 8, 2022

Europe’s exposure to the global gas market set to rise drastically

March 14, 2023

The LNG Market in June 2020: Qatar at Full Speed, US in Slow Motion

July 28, 2020

Wind generation in northwest Europe breaks records

February 21, 2022
European-Gas-Hub-Logo

European gas market intelligence platform featuring 2,600+ reports, presentations and industry insights, with new content added every week. more info

Categories

  • European Gas Prices
  • Energy Policy
  • European Gas Infrastructure
  • European Gas Storage
  • Coal Market
  • Supply & Demand
  • LNG
  • European Power Generation
  • Hydrogen
  • Russia
  • Unconventional Resources
  • Other

Recent Analysis

Gas-fired power rises in the EU despite higher gas prices

TTF prices down almost 20% as bearish pressures build

Gas demand destruction emerges as European gas prices surge

Weekly Updates

Sign up to receive our weekly newsletter with new European gas market reports, presentations & analysis. Every Tuesday.

Your subscription could not be saved. Please try again.
Your subscription has been successful.

By signing up, I agree to our TOS and Privacy Policy.

© 2026 EuropeanGasHub | All Rights Reserved

X-twitter Linkedin Youtube